


Equivalent doping of Te leads to optimized electrical and thermal transport properties in thermoelectric Cu2MnSnSe4 alloys
 0
0 
Abstract
Quaternary chalcogenides have garnered considerable interest within the field of thermoelectric due to their intrinsic low thermal conductivity, wide bandgap and high element enrichment advantages. In this work, the thermoelectric performance of Cu2MnSnSe4 was enhanced by co-optimizing the carrier concentration and lattice thermal conductivity through self-doping with Cu and doping with Te. A series of Cu2MnSnSe4 and

Keywords
INTRODUCTION
The energy crisis and environmental concerns have consistently driven the pursuit of sustainable energy. An increasing number of advanced energy materials, such as dielectric high entropy energy materials, solar cell energy materials and lithium-ion battery energy materials, have attracted widespread attention[1-3]. Additionally, thermoelectric materials and devices can convert waste heat into electric energy without causing environmental pollution, thus providing a new solution for alleviating the energy crisis and promoting green renewable energy[4,5]. However, the search for high-performance thermoelectric materials is a major obstacle to the widespread application of thermoelectric technology on a large scale[6]. The properties of thermoelectric materials are determined by the dimensionless figure of merit (zT = S2σT/κtot), where S2σ stands for the power factor (PF), T stands for the absolute temperature, and κtot indicates the total thermal conductivity (κtot = κL + κe, where κe and κL refer to electronic and lattice thermal conductivity, respectively). It is evident that a thermoelectric material with excellent performance should keep high PF and low κtot, but these parameters are interrelated[7]. Achieving optimal electrical and thermal transport performance simultaneously is challenging, making it difficult to attain a satisfactory zT[7,8]. Over the past two decades of research, many strategies have been successfully implemented in existing systems (Bi2Te3, PbTe, and GeTe)[9-12] to optimize thermoelectric parameters and increase zT, such as modulation doping[13,14], energy band engineering[15,16] and energy filtering effects[17], to optimize electrical transport performance; entropy engineering[18,19], defect engineering[20,21] and nanoengineering[22,23] are used to optimize thermal transport performance.
The development of high-performance thermoelectric materials should focus on not only optimizing existing systems, but also developing potential thermoelectric materials. Elements-rich quaternary chalcogenides have attracted widespread attention due to their intrinsic low thermal conductivity[24]. The crystal structure of quaternary chalcogenide is derived from a ZnSe supercell arranged in a double-periodic manner along the Z axis, with the Zn site being substituted by three different cations[25]. With the mismatch of atomic size between the substituting elements, Se atoms deviates from the original ideal tetrahedral position, resulting in lattice distortion and modification of the crystal structure from high-symmetry cubic structure to low-symmetry non-cubic structure, which is conducive to enhancing phonon scattering and inhibiting
In this work, the electrical and thermal transport properties of Cu2MnSnSe4 were simultaneously optimized through self-doping with Cu and doping with Te. A series of samples, including Cu2MnSnSe4 (S-1) and
EXPERIMENTAL SECTION
The elements Cu, Mn, Sn, Se, and Te (Aladdin, powder, purity > 99.9%) were weighed out in atomic proportions of S-1 to S-5 and then placed in a stainless steel tank (this was done in a glove box under an argon atmosphere). The tank was placed on a high-energy ball-milling machine and run for 10 h at
The chemical compositions and phase structures of the sample powder were analyzed by Rigaku Smartlab
RESULTS AND DISCUSSION
To confirm the phase purity of the samples after ball-milling and hot-pressing, X-ray diffraction (XRD) measurements were conducted for all samples. The XRD patterns of each sample are shown in Figure 1A. The sample's primary peaks correspond well to the tetragonal stannite structure (ICSD#155904) and then conducted local amplifications of the XRD patterns for all samples [Supplementary Figure 1]. The XRD peaks did indeed shift by a certain angle, as expected. To further ascertain the crystalline structure of the sample, taking S-5 as an example, using Fullprof software for Rietveld refinements [Figure 1B]. The Rietveld refinements calculation details for the remaining samples are presented in Supplementary Figure 2. The lattice parameters of all samples along the z and x axes (c and a) showed a slight change [Figure 1C], which is caused by the locality of point defects resulting from Te replacing Se and the low Te doping content. This phenomenon has also been observed in other quaternary chalcogenides[21,30,31]. The structure distortion parameters of all samples were calculated based on the lattice parameters calculated by Rietveld refinements, as shown in Figure 1D. Under the influence of the crystal field effect in quaternary chalcogenides, the triply degenerate valence band Γ15V of the cubic zinc blende structure splits into a non-degenerate band Γ4V and a doubly degenerate band Γ5V, resulting in a splitting energy ΔCF defined as ΔCF = E(Γ5V) - E(Γ4V). When η approaches 1, the sample displays high symmetry, and the ΔCF will be closer to 0, which is more favorable for maintaining better electrical properties[26]. All samples show η values above 0.98, indicating their high symmetry.

Figure 1. (A) Samples powder XRD pattern at room temperature (B) Rietveld refinement of S-5 with Fullprof software (C) The lattice parameters (a & b, c) of samples, (D) The relationship between structure distortion parameters η and band structure of samples[19].
The microstructure of the fracture surface of the sample was studied using SEM, and the results are depicted in Figure 2A-E. It was found that there are no obvious holes or cracks in all the samples within the entire scanning range and the grain size of the samples is less than five micrometers. These results show that the synthesized sample has a high density (≥ 96%), which corresponds to the high density measured in the experiment [Table 1]. To investigate the uniformity of element distribution in the sample, energy dispersive spectroscopy (EDS) analysis was conducted with S-5 as an example. As shown in Figure 2F-K, all elements Cu, Mn, Sn, Se and Te were uniformly distributed with no significant aggregation or dispersion observed. Additionally, the mass fraction of each element was provided in the Supplementary Figure 3.

Figure 2. SEM results of (A) S-1, (B) S-2, (C) S-3, (D) S-4, (E) S-5 and (F-K) EDS results for S-5.
The lattice parameters (a & b, c), cell volume (V), structure distortion parameter (η), experimental density (ρe), theoretical density (ρt), relative density (ρr), carrier concentration (nH) and carrier mobility (μH) of all samples at room temperature
| S-1 | S-2 | S-3 | S-4 | S-5 | |
| a & b (Å) | 5.752(6) | 5.749(6) | 5.758(7) | 5.751(9) | 5.759(8) |
| c (Å) | 11.378(6) | 11.388(1) | 11.359(3) | 11.350(5) | 11.376(6) |
| V (Å3) | 376.55 | 376.48 | 376.71 | 375.53 | 377.43 |
| η | 0.9890 | 0.9903 | 0.9863 | 0.9867 | 0.9876 |
| ρe (g cm-3) | 5.3974 | 5.4309 | 5.4383 | 5.4397 | 5.1705 |
| ρt (g cm-3) | 5.45195 | 5.4857 | 5.4932 | 5.4946 | 5.3859 |
| ρr (%) | 99 | 99 | 99 | 99 | 96 |
XPS was used to analyze the valence states of elements in S-5. As shown in Figure 3, Cu 2p showed two peaks at 931.4 and 951.3 eV [Figure 3A], corresponding to the valence state of Cu+[19]. The Mn 2p3/2 binding energy peak was observed at 640.8 eV, while the Mn 2p1/2 peak was observed at 653.3 eV [Figure 3B], which is also the case in Cu2MnSnSe4[19] and XPS study of Mn2+[32]. It can be concluded that the valence state of Mn in the sample is +2. Sn 3d5/2 and Sn 3d3/2 binding energy peaks were observed at 485.8 and 494.5 eV, respectively [Figure 3C], with no other significant peaks. In Cu2ZnSnSe4[33], the binding energy peak of Sn 3d5/2 is about 486 eV, indicating that Sn shows +4 valence. The Se 3d showed two peaks at 54 and 59.2 eV [Figure 3D], corresponding to the valence state of Se2-[16,30]. Comparison of the Se XPS peaks for the S-2 and

Figure 3. X-ray photoelectron spectroscopy of S-5: (A) Cu 2p (B) Mn 2p (C) Sn 3d (D) Se 3d.
Figure 4 shows the electrical performance measurement results of all samples. At 473 K, the σ of all samples reached its maximum value. Specifically, the σ for S-2 is 4.27 × 10⁴ S m-1, and for S-5, it is 1.56 × 10⁴ S m-1 at 473 K [Figure 4A]. At around 470 K, the σ shows a non-monotonic change; unlike the decrease in σ at high temperatures caused by thermally activated charge carriers in some functional materials[34], this change in conductivity behavior may be due to the transition from Cu ordered state to Cu disordered state[16]. With the doping of Te, the sample conductivity decreases continuously. Hall effect test at room temperature

Figure 4. Temperature dependences of (A) the electrical conductivity (σ), (C) the Seebeck coefficient (S) and (D) the power factor (PF) for all samples. (B) the room temperature Hall carrier concentration (nH) and mobility (μH) for all samples.
Figure 4C illustrates the relationship between the Seebeck coefficients (S) and temperature. All S exhibit positive values, suggesting that holes serve as the primary charge carriers. The S values of S-2 to S-5 are lower than those of S-1, due to the increase of nH. At 673 K, S-5 obtains a maximum S of 219 μV K-1 in the doped sample. The PF of each sample was calculated using PF = S2σ, and the temperature dependence of each sample’s PF was shown in Figure 4D. The PF of all the samples showed a monotonic temperature dependence, with the PF increasing with the temperature. At 673 K, the doped samples exhibit a higher PF compared to the undoped samples. In the low-temperature region (less than 450 K), the PF of S-2 to S-4 was almost the same, while the PF of S-5 remained high. With the temperature increase, the PF of S-2 further rises, reaching a maximum of 663 μW m-1 K-2 at 673 K. The temperature dependence of the PF of S-2 and
Figure 5A shows that the κtot of the samples exhibits a decreasing trend throughout the measured temperature range (consistent with the trend of changes in the thermal diffusivity coefficient (D),

Figure 5. The dependence of various thermal conductivity on temperature for all samples: (A) the total thermal conductivity (κtot) and electron thermal conductivity (κe), (B) the lattice thermal conductivity (κL) for all samples. (C) The theoretical κL of S-5 calculated based on Debye-Callaway model. (D) The total disorder parameter (Γ), the mass fluctuation parameter (ΓM) and strain field fluctuation parameter (ΓS) for all samples.
To further explore the reasons for the change of thermal conductivity, ultrasonic measurement was conducted on all samples, and the results are shown in Table 2. The average sound velocity (va), Grüneisen parameter (γ), mean free path of phonons (lph), the heat capacity (Cp) and Debye temperature (θD) were calculated for all samples (the relevant calculation details are shown in Supplementary Material). It is evident from Table 2 that the va of all samples remains nearly constant, and the heat capacity remains unchanged at
The transverse sound velocity (vt), longitudinal sound velocity (vl), average sound velocity (va), Debye temperatures (θD), Grüneisen parameter (γ), mean free path of phonons (lph) and specific heat capacity (Cp) for all samples at room temperature
| S-1 | S-2 | S-3 | S-4 | S-5 | |
| vt (m s-1) | 1,938 | 1,943 | 1,882 | 1,959 | 1,818 |
| vl (m s-1) | 3,607 | 3,871 | 3,609 | 3,840 | 3,521 |
| va (m s-1) | 2,164 | 2,180 | 2,106 | 2,195 | 2,036 |
| θD | 225 | 227 | 219 | 229 | 211 |
| γ | 1.75 | 1.99 | 1.86 | 1.93 | 1.89 |
| lph (nm) | 2.07 | 2.12 | 2.12 | 1.83 | 1.68 |
| Cp (J g-1 K-1) | 0.32 | 0.32 | 0.32 | 0.32 | 0.32 |
Theoretical simulations of the experimental κL were conducted using the Debye-Callaway model, with phonon-phonon Umklapp scattering (U), Normal scattering (N), grain boundary scattering (GB) and point defects scattering (PD) as the primary scattering mechanisms. In the Debye-Callaway model, the κL of a material can be expressed as:
Phonon relaxation time is the result of multiple scattering mechanisms, which can be expressed as:
where kB is the Boltzmann constant;
With the increase of defect concentration, the mass and strain field fluctuations will be further induced, which will affect the total disorder of the crystal. Γ = ΓM + ΓS, where Γ is the total disorder parameter, ΓM is the mass fluctuation parameter and ΓS is the strain field fluctuation parameter (the relevant calculation details of ΓM and ΓS are shown in Supplementary Material). Figure 5D illustrates the variation of the mass fluctuation parameter and the strain field fluctuation parameter. It is evident that both ΓM and ΓS increase with the Te, and for each set of samples, the value of ΓS exceeds ΓM, suggesting that the strain field fluctuation scattering make the primary contribution to reducing κL. Since the atomic radius of Te is larger than that of Se, the substitution of Se by Te leads to deviations in atomic positions and thus increasing local lattice distortions. This is the main reason for why ΓS is greater than ΓM. In conclusion, these factors can well explain the contribution of point defects to the decrease of κL.
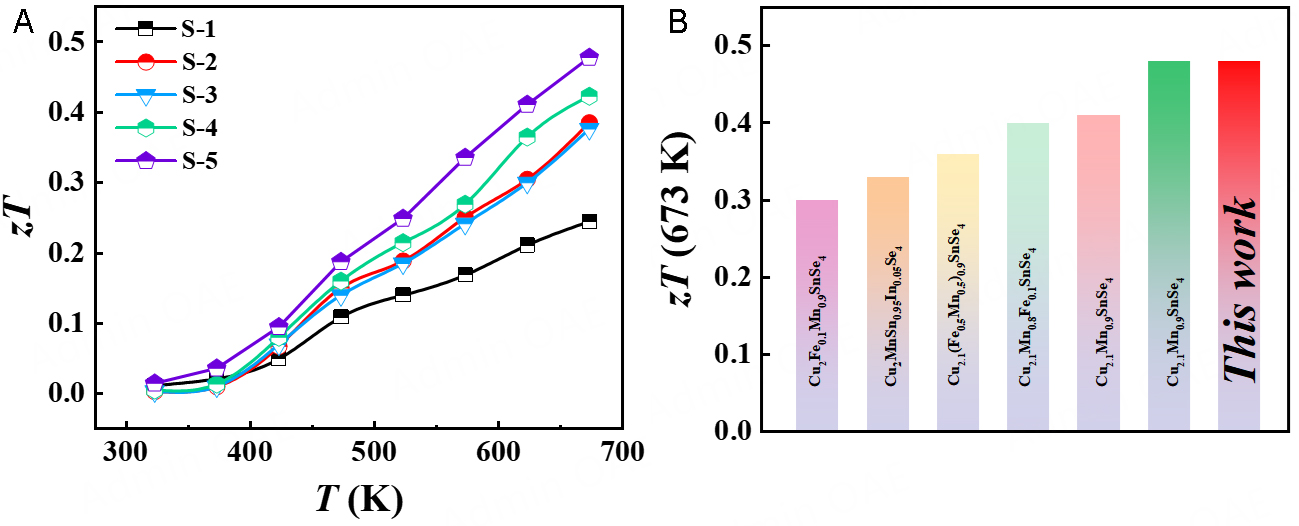
The relationship between the zT and temperature is shown in Figure 6A. After Te doping, zT is significantly enhanced throughout the measured temperature range due to the optimized PF and low κL. Finally, S-5 achieves the maximum zT ~ 0.5 at 673 K, roughly twice that of the S-1. Supplementary Figure 7 compares the thermoelectric properties between Cu2.1Mn0.9SnSe3.9Te0.2 and Cu2.1Mn0.9SnSe3.9Te0.1
CONCLUSIONS
In this work, a series of samples, including Cu2MnSnSe4 (S-1) and Cu2.1Mn0.9SnSe4-xTex (x = 0,0.01,0.05,0.10; S-2 to S-5), were successfully synthesized by ball-milling and hot-pressing methods, and their structural components and electrothermal transport properties were studied. Rietveld refinement and SEM showed that all samples are tetragonal stannite structures with high density. XPS showed that Te doping does not change the valence states of the sample elements. The increase of nH leads to elevation of the σ in S-5, and the PF of S-5 reaches 530 μW m-1 K-2 at 673 K. As the doping content of Te increases, the defect concentration in the samples also rises, resulting in enhanced scattering effects on phonons, thus reducing the lph and hindering phonon transport, which significantly reduces the κL. At 673 K, S-5 reaches a minimum κL of 0.62 W m-1 K-1. Due to the improvement of PF and the decrease of κL, S-5 reaches zT ~ 0.5, which is about twice that of the S-1 at 673 K. Therefore, it can be shown that the introduction of Te can further improve the thermoelectric performance of Cu2MnSnSe4-based compounds.
DECLARATIONS
Authors’ contributions
Writing original draft and Data curation: Liu, F.
Manuscript revision: Sun, Y.; Li, Z.; Peng, P.
Supervision and Resources: Wang, C.; Wang, H.
Availability of data and materials
The rata data supporting the findings of this study are available within this Article and its Supplementary Material. Further data are available from the corresponding authors upon request.
Financial support and sponsorship
The work is financially supported by the Natural Science Fund of China under Grant Nos. 52171216 and 52472221, Qilu Young Scholar Program of Shandong University and Core Facility Sharing Platform of Shandong University.
Conflicts of interest
All authors declared that there are no conflicts of interest.
Ethical approval and consent to participate
Not applicable.
Consent for publication
Not applicable.
Copyright
© The Author(s) 2025.
Supplementary Materials
REFERENCES
1. Wang, X.; Wang, Y.; Wu, M.; Fang, R.; Yang, X.; Wang, D. Ultrasonication-assisted fabrication of porous ZnO@C nanoplates for lithium-ion batteries. Microstructures 2022, 2, 2022016.
2. Zhang, S. High entropy design: a new pathway to promote the piezoelectricity and dielectric energy storage in perovskite oxides. Microstructures 2023, 3, 2023003.
3. Liu, X.; Webb, T.; Dai, L.; et al. Influence of halide choice on formation of low-dimensional perovskite interlayer in efficient perovskite solar cells. Energy. Environ. Mater. 2022, 5, 670-82.
4. Bell, L. E. Cooling, heating, generating power, and recovering waste heat with thermoelectric systems. Science 2008, 321, 1457-61.
6. Cao, T.; Shi, X. L.; Zou, J.; Chen, Z. G. Advances in conducting polymer-based thermoelectric materials and devices. Microstructures 2021, 1, 2021007.
7. Mao, J.; Zhu, H.; Ding, Z.; et al. High thermoelectric cooling performance of n-type Mg3Bi2-based materials. Science 2019, 365, 495-8.
9. Vijay, V.; Harish, S.; Archana, J.; Navaneethan, M. Synergistic effect of grain boundaries and phonon engineering in Sb substituted Bi2Se3 nanostructures for thermoelectric applications. J. Colloid. Interface. Sci. 2022, 612, 97-110.
10. Wu, Y.; Nan, P.; Chen, Z.; et al. Manipulation of band degeneracy and lattice strain for extraordinary PbTe thermoelectrics. Research 2020, 2020, 8151059.
11. Kim, S. I.; Lee, K. H.; Mun, H. A.; et al. Dense dislocation arrays embedded in grain boundaries for high-performance bulk thermoelectrics. Science 2015, 348, 109-14.
12. Liu, W. D.; Wang, D. Z.; Liu, Q.; Zhou, W.; Shao, Z.; Chen, Z. G. High-performance GeTe-based thermoelectrics: from materials to devices. Adv. Energy. Mater. 2020, 10, 2000367.
13. Han, M. K.; Yu, B. G.; Jin, Y.; Kim, S. J. A synergistic effect of metal iodide doping on the thermoelectric properties of Bi2Te3. Inorg. Chem. Front. 2017, 4, 881-8.
14. Feng, L.; Guo, A.; Liu, K.; et al. Highly deformable Ag2Te1-xSex-based thermoelectric compounds. Mater. Today. Phys. 2023, 33, 101051.
15. Heremans, J. P.; Jovovic, V.; Toberer, E. S.; et al. Enhancement of thermoelectric efficiency in PbTe by distortion of the electronic density of states. Science 2008, 321, 554-7.
16. Zheng, J.; Hong, T.; Wang, D.; Qin, B.; Gao, X.; Zhao, L. Synergistically enhanced thermoelectric properties in n-type Bi6Cu2Se4O6 through inducing resonant levels. Acta. Mater. 2022, 232, 117930.
17. Zhang, Z.; Zhao, K.; Chen, H.; et al. Entropy engineering induced exceptional thermoelectric and mechanical performances in
18. Hu, L.; Zhang, Y.; Wu, H.; et al. Entropy engineering of SnTe: multi-principal-element alloying leading to ultralow lattice thermal conductivity and state-of-the-art thermoelectric performance. Adv. Energy. Mater. 2018, 8, 1802116.
19. Sun, Y.; Wang, H.; Yao, J.; et al. High symmetry structure and large strain field fluctuation lead enhancement of thermoelectric performance of quaternary alloys by tuning configurational entropy. Chem. Eng. J. 2023, 462, 142185.
20. Liu, M.; Sun, Y.; Zhu, J.; et al. High performance GeTe thermoelectrics enabled by lattice strain construction. Acta. Mater. 2023, 244, 118565.
21. Song, Q.; Qiu, P.; Chen, H.; et al. Enhanced carrier mobility and thermoelectric performance in Cu2FeSnSe4 diamond-like compound via manipulating the intrinsic lattice defects. Mater. Today. Phys. 2018, 7, 45-53.
22. Zhang, Y. X.; Lou, Q.; Ge, Z. H.; et al. Excellent thermoelectric properties and stability realized in copper sulfides based composites via complex nanostructuring. Acta. Mater. 2022, 233, 117972.
23. Zhuang, H. L.; Hu, H.; Pei, J.; et al. High ZT in p-type thermoelectric (Bi,Sb)2Te3 with built-in nanopores. Energy. Environ. Sci. 2022, 15, 2039-48.
24. Wang, T.; Huo, T.; Wang, H.; Wang, C. Quaternary chalcogenides: promising thermoelectric material and recent progress. Sci. China. Mater. 2020, 63, 8-15.
25. Song, Q.; Qiu, P.; Hao, F.; et al. Quaternary Pseudocubic Cu2TMSnSe4 (TM = Mn, Fe, Co) chalcopyrite thermoelectric materials. Adv. Elect. Mater. 2016, 2, 1600312.
26. Zhang, J.; Liu, R.; Cheng, N.; et al. High-performance pseudocubic thermoelectric materials from non-cubic chalcopyrite compounds. Adv. Mater. 2014, 26, 3848-53.
27. Song, Q.; Qiu, P.; Chen, H.; et al. Improved thermoelectric performance in nonstoichiometric Cu2+δMn1−δSnSe4 quaternary diamondlike compounds. ACS. Appl. Mater. Interfaces. 2018, 10, 10123-31.
28. Mehmood, F.; Sun, Y.; Su, W.; et al. Improved thermoelectric performance of in-doped quaternary Cu2MnSnSe4 alloys. Phys. Status. Solidi. 2022, 16, 2200049.
29. Sun, Y.; Abbas, A.; Wang, H.; et al. Enhancement of thermoelectric performance of Cu2MnSnSe4 alloys by regulation of lattice strain. Chem. Eng. J. 2024, 486, 150158.
30. Mukherjee, B.; Isotta, E.; Malagutti, M. A.; et al. Thermoelectric performance in disordered Cu2ZnSnSe4 nanostructures driven by ultra-low thermal conductivity. J. Alloys. Compd. 2023, 933, 167756.
31. Chen, Q.; Yan, Y.; Zhan, H.; et al. Enhanced thermoelectric performance of chalcogenide Cu2CdSnSe4 by ex-situ homogeneous nanoinclusions. J. Materiomics. 2016, 2, 179-86.
32. Cheng, Y.; Qumu, G.; Huang, T.; Miao, A.; Wen, G. Potassium ferrate enhanced active manganese oxide filter material to remove BPA: influence of NH4+, Mn2+. Sep. Purif. Technol. 2024, 341, 126903.
33. Henríquez, R.; Salazar Nogales, P.; Grez Moreno, P.; et al. Solvothermal synthesis of Cu2ZnSnSe4 nanoparticles and their visible-light-driven photocatalytic activity. Nanomaterials 2024, 14, 1079.
34. Xie, S.; Xu, Q.; Chen, Q.; Zhu, J.; Wang, Q. Realizing super-high piezoelectricity and excellent fatigue resistance in domain-engineered bismuth titanate ferroelectrics. Adv. Funct. Mater. 2024, 34, 2312645.
35. Chetty, R.; Bali, A.; Mallik, R. C. Thermoelectric properties of indium doped Cu2CdSnSe4. Intermetallics 2016, 72, 17-24.
36. Wei, K.; Nolas, G. S. Synthesis and characterization of nanostructured stannite Cu2ZnSnSe4 and Ag2ZnSnSe4 for thermoelectric applications. ACS. Appl. Mater. Interfaces. 2015, 7, 9752-7.
37. Song, Q.; Qiu, P.; Zhao, K.; Deng, T.; Shi, X.; Chen, L. Crystal structure and thermoelectric properties of Cu2Fe1-xMnxSnSe4 diamond-like chalcogenides. ACS. Appl. Energy. Mater. 2020, 3, 2137-46.
Cite This Article

How to Cite
Download Citation
Export Citation File:
Type of Import
Tips on Downloading Citation
Citation Manager File Format
Type of Import
Direct Import: When the Direct Import option is selected (the default state), a dialogue box will give you the option to Save or Open the downloaded citation data. Choosing Open will either launch your citation manager or give you a choice of applications with which to use the metadata. The Save option saves the file locally for later use.
Indirect Import: When the Indirect Import option is selected, the metadata is displayed and may be copied and pasted as needed.
About This Article
Copyright

Data & Comments
Data
0


Comments
Comments must be written in English. Spam, offensive content, impersonation, and private information will not be permitted. If any comment is reported and identified as inappropriate content by OAE staff, the comment will be removed without notice. If you have any queries or need any help, please contact us at [email protected].