fig10

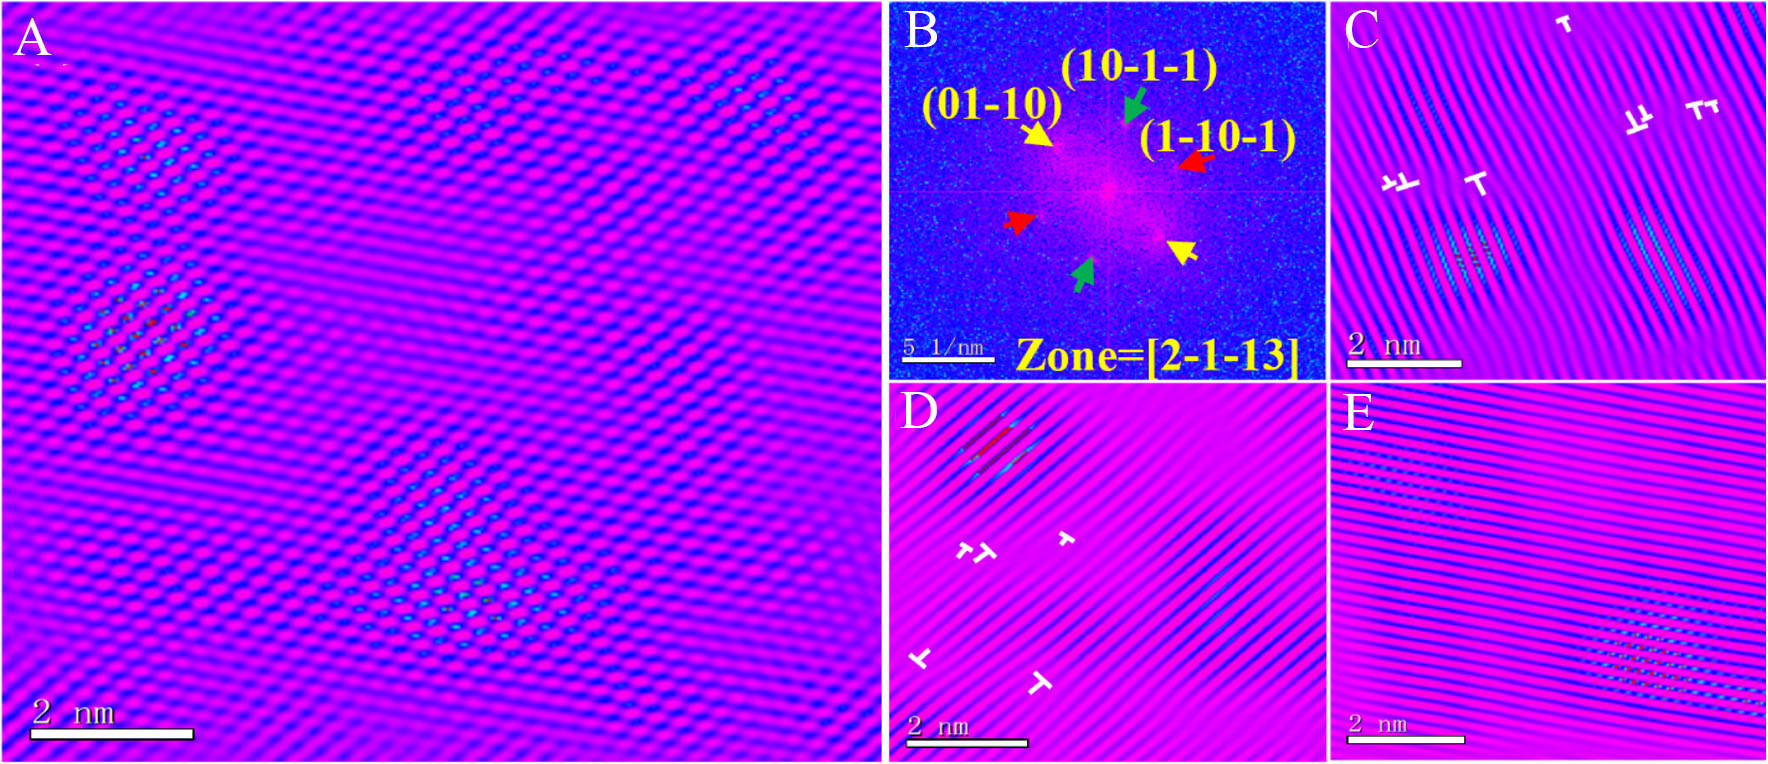
Figure 10. HRTEM images and SAED pattern of the purple regions in Figure 6B. (A) HRTEM image of green region in Figure 6B; (B) SAED pattern of green region in Figure 10A; (C) IFFT image along the (1-10-1) crystal plane; (D) IFFT image along the (10-1-1) crystal plane; (E) IFFT image along the (01-10) crystal plane. Dislocations are marked with the symbol⊥. HRTEM: High-resolution TEM; TEM: transmission electron microscopy; SAED: selected area electron diffraction; IFFT: inverse fast fourier transform.


