


All-solid-state lithium batteries with NMC955 cathodes: PVDF-free formulation with SBR and capacity recovery insights


Abstract
The nickel-rich NMC955 (LiNi0.90Mn0.05Co0.05O2) cathode, with minimal cobalt, is the zenith of LiNixMnyCo1-x-yO2 (NMC) technology but faces structural and thermal stability challenges, losing an average of 15% of its capacity in the first discharge. Here, by selecting appropriate materials and synthesis methods in an all-solid-state battery cell, this challenge is effectively mitigated. A sustainable fabrication of the LiNMC955 positive electrode, excluding poly(vinylidene fluoride) (PVDF) and using styrene-butadiene rubber, demonstrates high retention in
Keywords
INTRODUCTION
Conventional lithium-ion batteries (LIBs) are approaching their energy density limits due to using traditional active materials and liquid organic electrolytes[1-5]. The active cathode material plays a crucial role as it usually defines the specific capacity of the batteries[6]. Various cathode active materials have been refined recently, including LiNixMnyCo1-x-yO2 (NMC)[7-10], LiNi1-x-yMnxAlyO2 (NMA)[11,12], LiFePO4 (LFP)[13-16], LiMn0.6Fe0.4PO4 (LMFP)[17,18], and LiNiyMn2-yO4 (LNMO)[19-21]. These materials have the potential to enhance cell performance and stability. Among them, NMC-based batteries have gained popularity in the market[22], becoming the dominant cathode material in electric and hybrid vehicles and other electronic devices[19]. The synergy of nickel, cobalt, and manganese in the NMC structure contributes to high specific energy and structural stability of the cathode and lithium-ion diffusion processes[22,23], leading to enhanced performance and extended cycle life.
Several stoichiometries of NMC have been reported, such as NMC333, NMC532, NMC622, NMC721, NMC811, and LiNi0.90Mn0.05Co0.05O2 (NMC955)[9]. The first NMC333 commercialized was unable to meet the demand for electric vehicle applications. Consequently, a modification was implemented, increasing the Ni content, which resulted in enhanced capacity, rate performance, and lifetime[22]. Sustainability was also an important factor, as decreasing the amount of cobalt is of utmost urgency[11,24].
However, the adoption of this Ni-rich material must be carefully considered, as structural stability issues may arise when the Co3+ ions decrease relative to the Ni3+/4+ content, leading to diminished effectiveness of Co3+ as a buffer ion to alleviate magnetic frustration due to Ni3+/4+ paramagnetic character[9,22]. A rock salt structure may form at the surface of NMC as a degradation product during battery operation, for example, by charging to high voltages (> 4.2 V)[25] or due to aging (LixNiO2-δ: oxygen deficiency due to lattice oxygen release; Ni1-δO: reduced nickel oxide phase due to oxygen loss). The formation of a rock salt structure in NMC is typically undesirable as it can lead to performance degradation, including capacity loss
One way to reduce the structural instability of these Ni-rich cathodes is to choose a tailored fabrication method[9] and rigorous electrochemical cut-offs while cycling, allowing the recovery of the cell as shown in calorimetric results hereafter. The preparation method affects the physical and electrochemical properties of the cathode material. Therefore, selecting cathode preparation methods compatible with the industry is crucial, thus ensuring a cost-effective scaling process. The most popular method for cathode industrial production is the wet method[22,26,27], which allows for precise control of the composition, mixture uniformity, and particle morphology necessary to achieve optimal electrochemical performance[9] impeding the formation of spurious phases at the surface (e.g., spinel and rock salt). This study presents a novel wet fabrication method for a cathode featuring a nearly cobalt-free active material, NMC955 [Figure 1].

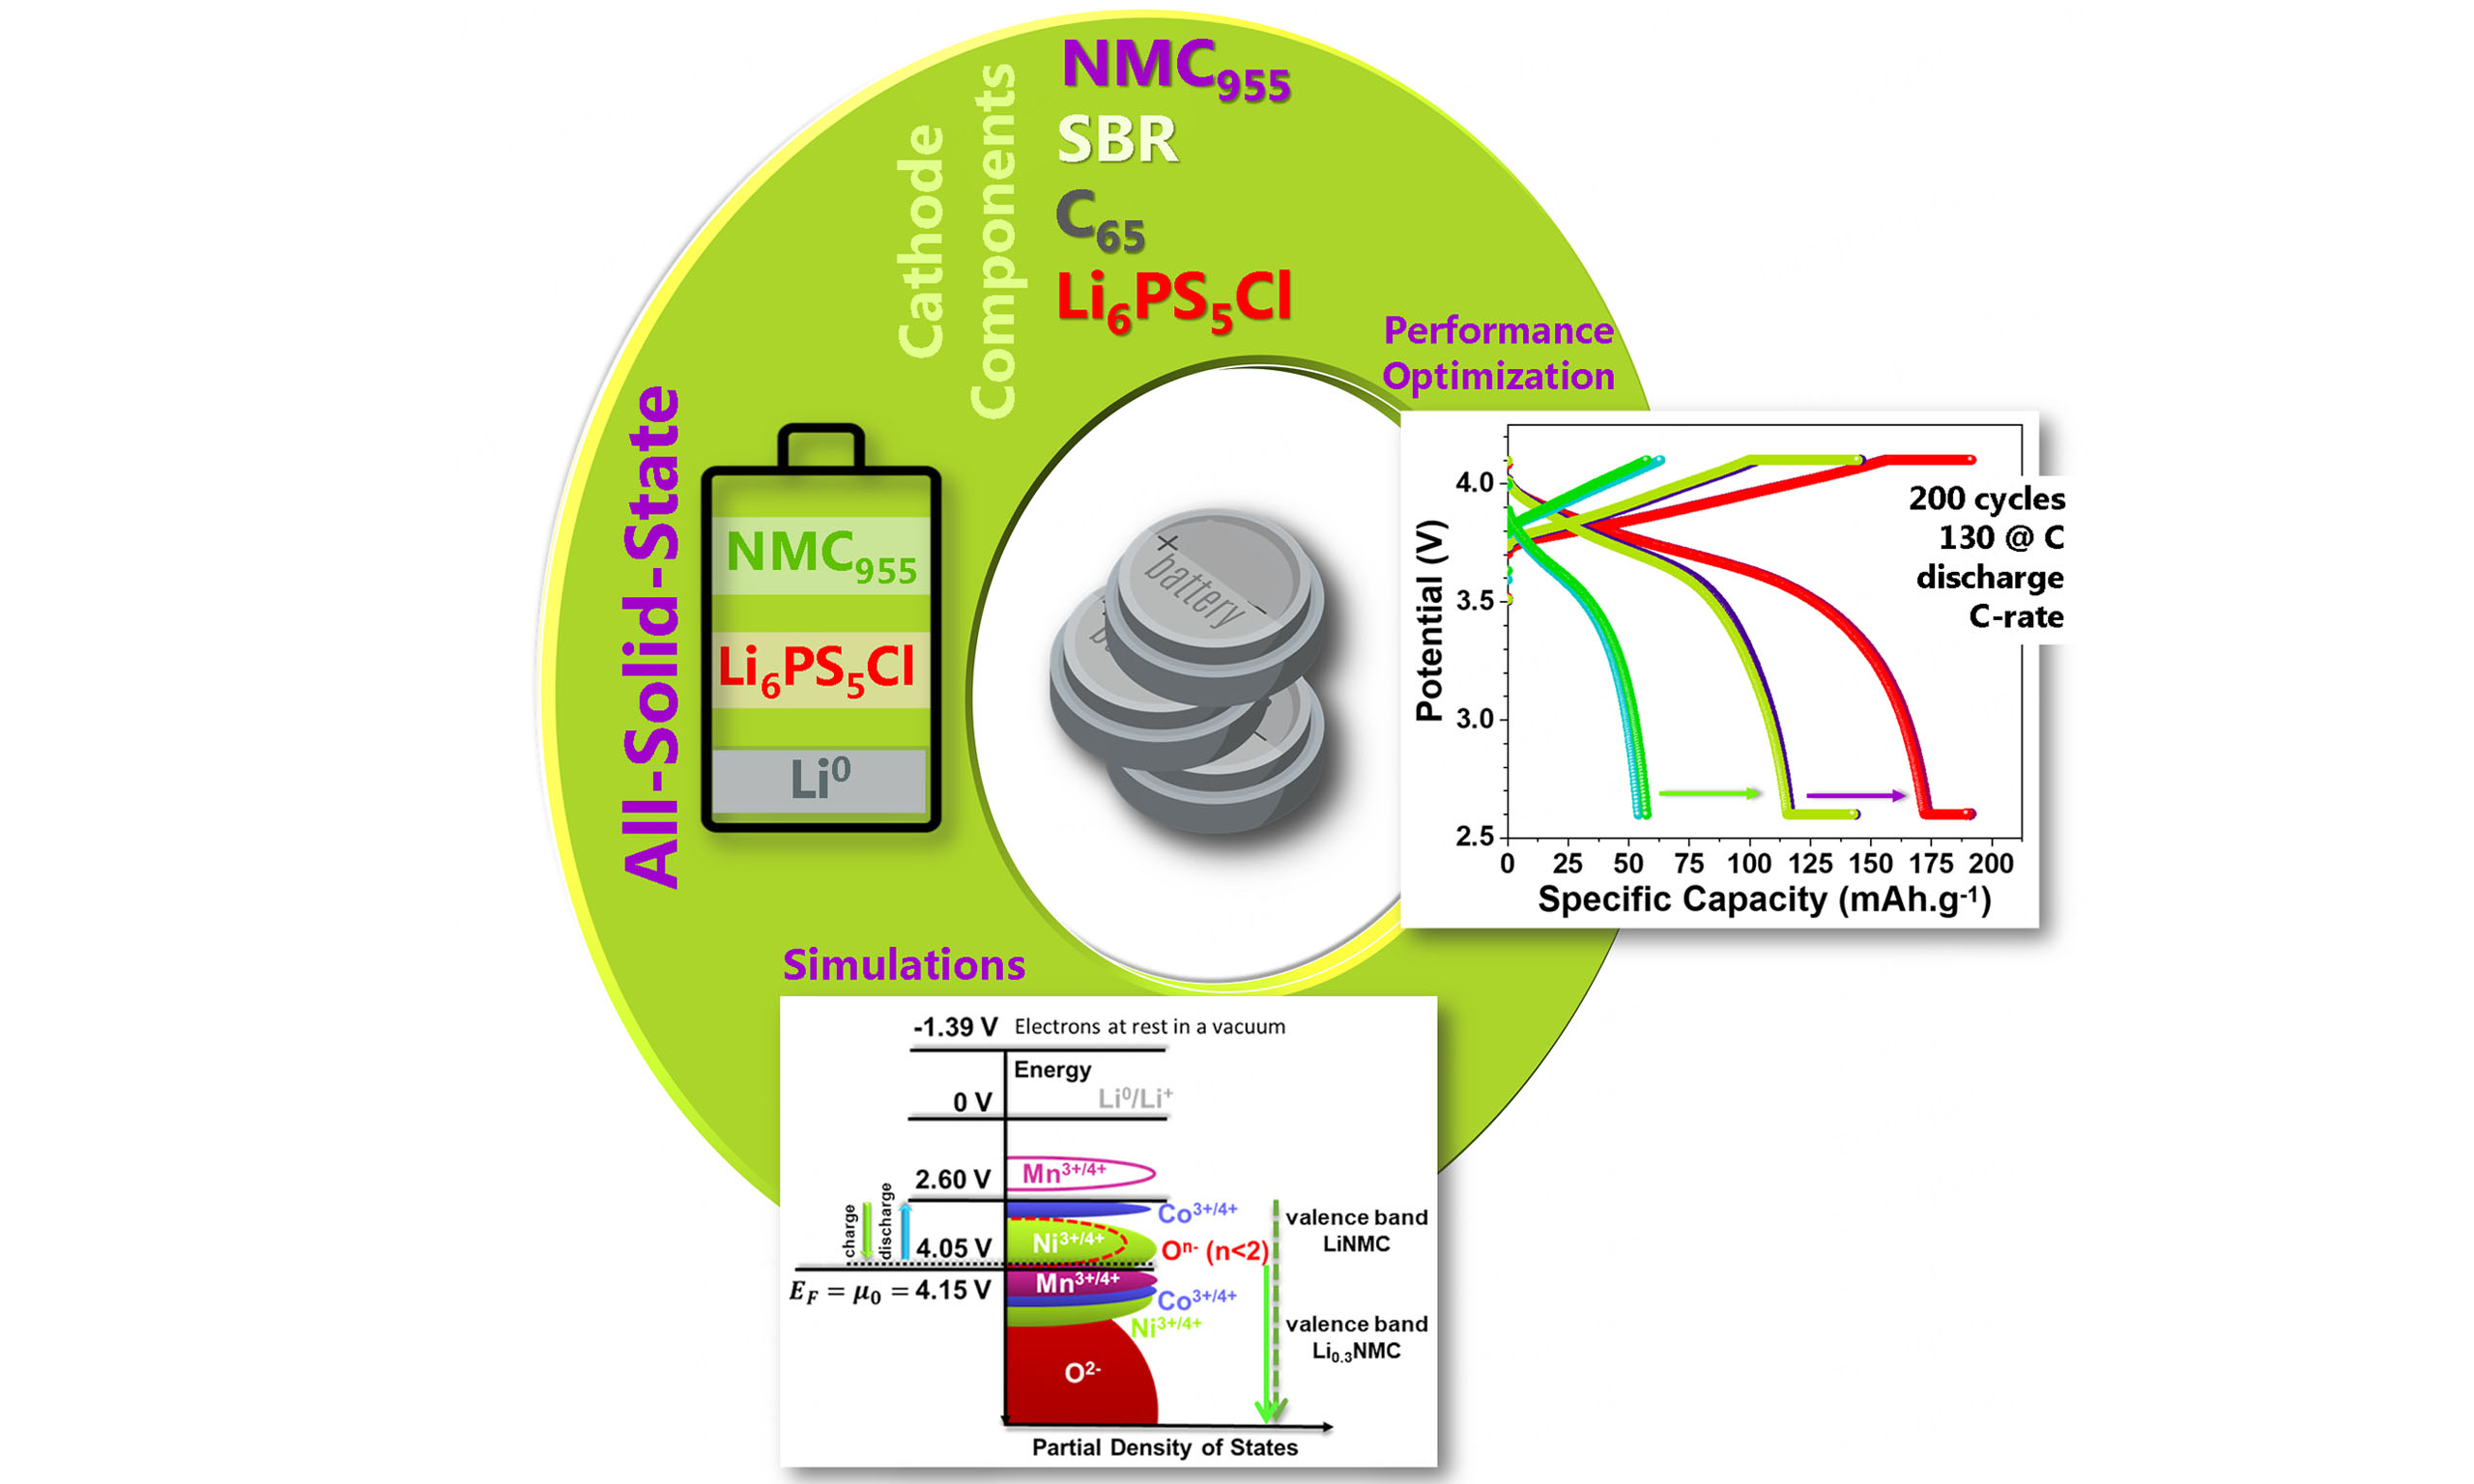
Figure 1. Summary of the adopted methodology. Left: cathode fabrication process using a wet method developed inside a glove box. Center: resulting cathode incorporated into an all-solid-state coin cell, assembled in the glove box. Right: visual representation of the testing procedure and ab initio simulations related to battery materials and experiments.
To enhance battery safety, a departure from conventional liquid electrolytes led to the adoption of a
Adding the electrolyte to the cathode solution requires the search for chemically compatible binders and solvents[30]. The poly(vinylidene fluoride) (PVDF) binder is commonly used in LIBs[33]. However, its use is nearing its end as the European Union plans to eliminate potential sources of environmental contamination by fluorinated organics[34]. This decision entails banning the manufacture and use of per- and polyfluoroalkyl substances (PFAS), including PVDF. PFAS has come under intense scrutiny in Europe due to mounting evidence of their toxic effects on human health and the environment[34,35]. This decision increases the need to select alternative binders to develop new generations of batteries[36]. PVDF mixed with a polar solvent such as N-methyl-2-pyrrolidone (NMP) is not compatible with LPSCl as it reacts, making it unsuitable as a binder in the herein proposed all-solid-state battery. A comprehensive literature review and an analysis of its properties[30,36-39], such as low polarity, identified styrene-butadiene rubber (SBR) as a potential binder used with toluene as a solvent. SBR is a binder commonly used on the anode side for graphite silicon-based materials[40] and has also begun to be employed on the cathode side, such as NMC[41,42] and LNMO[43,44]. SBR enhances the flexibility of electrodes and strengthens their adhesion[40]. However, this binder has been primarily implemented in cells containing liquid electrolytes[40-42,45]. Herein we report its application to all-solid-state batteries. Control studies using PVDF and SBR as binders in NMC955 cathodes, using liquid electrolytes, show that SBR performs better than PVDF, even in liquid electrolyte cells
To ensure the cell is guarded against detrimental spurious reactions affecting their longevity[46,47], it is paramount to accurately determine the charge and discharge potential cut-offs and capacities to avoid reducing (discharge) or oxidizing (charge) the cathodes to voltages at which a different charge carrier (h+) becomes predominant and the cathode oxidized. In other words, the number of free electrons,
A series of simulations [Figures 1 and 2, Supplementary Figure 2] were conducted to address the aforementioned questions regarding the present materials[13,15,28]. The objective was to identify the optimal parameters for the electrochemical cycles of the NMC955 active cathode material. It involved determining pinpoint voltages, phases, capacities, cut-offs, and electrical properties such as cathode conductivity and density of states (DOS) (Experimental Section).

Figure 2. Ab initio simulations on (LiNMC955) = Li12Ni10MnCoO24 = LiNi0.833Mn0.083Co0.083O2 and (Li0.29NMC955) = Li7Ni20Mn2Co2O48 = Li0.291Ni0.833Mn0.083Co0.083O2 using DFT. (A) Simulated potential vs. electron carrier density (+electrons; -holes) for (LiNMC955) and (Li0.29NMC955); (B) charge carriers concentration vs. temperature (-electrons; +holes): experiments by Hall effect with the cathode 57% NMC955+38% Li6PS5Cl+3% C65+2% SBR and simulations for different chemical potentials for (LiNMC955); (C) sheet conductivity vs. temperature for the same cathode and simulations for different chemical potentials for (LiNMC955) vs. Li0; I-first cooling, II-first heating; III-second cooling; (D) simulated electronic DOS vs. chemical potential at -221 T (C) 107 for (LiNMC955) and (Li0.29NMC955) featuring predominant redox pairs. The structures were approximated to NMC955 as much as computationally reasonable (between NMC811 and NMC955); (E) schematics representing energy vs partial DOS for LiNMC955 discharged cathode and correspondent predominant redox pairs. Note: the schematic in E is based on the results obtained with DOS simulations and shown in D. DFT: Density functional theory; SBR: styrene-butadiene rubber; DOS: density of states.
EXPERIMENTAL
Materials
The cathode material was meticulously prepared using a mixture of 57% NMC955 (Huayou New Energy Technology), 38% LPSCl (NEI corporation), 3% Active Carbon (TIMCAL graphite & carbon super C65), and 2% binder (SBR-1502 KUMHO, cold-polymerized SBR, containing 23.5 at/wt. % styrene, HB Chemical). The solvent used in this solution was toluene (Honeywell, purity ≥ 99.7%).
Cathode preparation
The preparation process involved four main steps [Figure 1]: 1st the binder SBR was mixed with 5 mL of toluene for 24 h; 2nd NMC955 and C65 were added to the solution and mixed for another 24 h; 3rd the electrolyte was introduced to the last mixture, and all was stirred for an additional 24 h, and 4th using a
Cell fabrication and electrochemical characterization
A bilayer of the previously prepared cathode material and LPSCl solid electrolyte was formed. To achieve this, 100 mg of LPSCl was pressed onto the cathode disk for one minute at 1 ton, using a mold with a
Cathode characterization (Hall effect and sheet resistance)
Hall effect measurements were performed using the Linseis HCS 1 Hall effect measurement system with two magnetic circuits (Neodymium) assembled on a moveable sled. Samples were prepared as positive electrode films, ensuring they were suitable for Hall effect measurements. The prepared sample was then mounted on the sample holder of the Linseis HCS system, with electrical connections established between the sample edges and the input terminals of the measurement system. A perpendicular magnetic field B, B = ±0.7 T, was applied to the sample, and the intensity of the magnetic field was adjustable and accurately measured by the system. A constant current (I) [DC: 1nA up to 125 mA (8 decades/compliance 12 V)] was transported through the sample along its length. The Hall voltage (VH), generated perpendicular to the applied current and the magnetic field, was measured [DC: low noise/low drift 1 μV up to 2,500 mV, 4 decades amplification, digital resolution: 300 pV]. This voltage arises due to the Lorentz force acting on the charge carriers within the sample. Hall voltage measurements were recorded for various magnetic field intensities and current values to ensure accuracy, with multiple measurements conducted for repeatability. The Hall coefficient (RH) was calculated using
Samples were prepared with a uniform thickness suitable for sheet resistance measurements. Following the Van der Pauw method, four collinear electrical contacts were attached to the samples when mounted on the sample holder, and electrical connections were made to the measurement system. A constant current (I) was applied between two adjacent contacts on the sample, and the voltage (V) was measured between the remaining two adjacent contacts. Measurements were taken in different configurations, rotating the contacts to ensure precision and consistency, with multiple readings recorded for each configuration. The sheet resistance (RS) was calculated using
All measurements were conducted in a controlled environment. The system was evacuated to 10-2 bar, and subsequently, an N2 flux of 4-5 L/min, was used to minimize spurious reactions, temperature fluctuations, and external noise.
The results were analyzed to determine the Hall coefficient, carrier concentration, mobility, and sheet resistance. They were then compared with theoretical values and reference materials for validation.
Cathode characterization (scanning electron microscope/energy dispersive spectroscopy and atomic force microscope/scanning kelvin probe microscopy)
A scanning electron microscope (SEM) FEI QUANTA 400 FEG ESEM was used. The chemical composition analysis was performed with an EDAX Genesis X4M energy-dispersive X-ray spectrometer. Microstructural observations and chemical composition analyses were conducted using an accelerating voltage of 15 kV, a spot size between 3 and 5, and a working distance of 10 µm. Images were taken at magnifications ranging from 20× to 20,000×. All images were obtained with a backscattered electron (BSE) detector. To further characterize the cathode material, an Atomic Force Microscope (AFM) capable of conducting Scanning Kelvin Probe Microscopy (SKPM) was employed (Oxford Instruments Atomic Force Microscope MFP-3D Origin+ AFM). The analysis was made with a laser-driven tip with a resonant frequency of approximately
Cathode characterization (TOF-SIMS and Raman)
TOF-SIMS analyses were carried out in a M6 TOF-SIMS instrument (IONTOF GmbH, Münster, Germany) using 30 keV Bi3+ primary ions. The sample was mounted on the sample holder (top-mount, without contact with the cathode surface) inside a glove box and transferred into the TOF-SIMS instrument using an air-tight transfer vessel (IONTOF GmbH). Positive and negative ion data were recorded in the
The cycled cell used in the TOF-SIMS analysis had an areal capacity of 1.90 mAh.cm-2 and was subjected to PEIS, cyclic voltammetry, and electrochemical cycling [Supplementary Figure 3]. The electrochemical potential range was set between 2.6 V and 4.1 V. The cell underwent ten cycles, with three cycles at C/50, 3 at C/20, 3 at C/10, and 1 at C/5 before TOF-SIMS post-mortem analyses.
Raman spectra were collected at room temperature with a Raman spectrometer (Renishaw inVia Confocal Raman, Reinshaw, Wotton-under-Edge, UK) equipped with a laser of 532 nm excitation wavelength focused through an inverted microscope (Leica, Wetzlar, Germany), via a 50× objective. A composite NMC955 electrode was placed in an air-sensitive sample holder and the sample preparation was performed inside the glovebox (H2O, O2 ≤ 1 ppm).
The cell used for post-mortem Raman testing had a cathode loading of 1.6 mAh.cm2 and was cycled between 2.6 V and 4.1 V at a C-rate of C/20 for up to ten cycles. A CV step was introduced during charge and discharge.
Cell characterization (Calorimetry)
Heat flow analysis was conducted using a TAM IV microcalorimeter (TA Instruments), which provides high sensitivity measurements. The experiment was performed at a constant temperature of 30 °C. The cell under investigation was cell CC I [Supplementary Table 1] and consisted of lithium metal as the anode, LPSCl as the electrolyte-separator, and an NMC955-based cathode material. The calorimetric analysis was the final test performed on the cell. For the test, a reference cell was also assembled for comparison, consisting solely of a top cap, bottom cap, separator, and a spring all made of stainless steel. When the heat flow started, the cell displayed an OCV of 3.7 V. To further investigate the internal heat flow behavior, external resistors (217 kΩ and 253 kΩ) were connected to the cell through an external circuit. These resistors allowed for an evaluation of heat flow during the discharge of the battery.
Density functional theory and structural, electronic, and potential energy simulations
In the computational analysis, the study employed density functional theory (DFT)[49], facilitated by the Vienna Ab initio Simulation Package (VASP)[49] code. Simulations were focused on a [Li12MnCo(Ni5O12)2]2 - LiNi0.833(3)Mn0.083(3)Co0.083(3)O2 (P1) supercells originally optimized from a R-3m (hP18) rhombohedral disordered structure with a = b = 2.874 Å and c = 14.165 Å and α = β = 90 and γ = 120. To the latter disordered structure, Li was randomly removed until it became Li7Mn2Co2Ni20O48 -
Tools from VASP and Electronics within the MedeA 3.7 software were utilized for calculating chemical potentials µi, charge carrier densities n, sheet conductivities σ, mobilities µ’, electronic band structures, and DOS.
RESULTS AND DISCUSSION
Simulations to determine optimal cycling thresholds
To comprehend the behavior of NMC955, ab initio simulations using DFT[49] were performed to determine optimal parameters for testing, such as the potential (V) limits for the electrochemical cycles [Figure 2A] and cycle curve morphologies [Figure 2A]. The cut-off charging voltage was determined to be 4.05 V, coinciding with the (LixNMC955) with 0.29 < x < 1 solid solution transforming from (LiNMC955) to
Herein, the importance of discharging at CV of ~2.60 V becomes clear as the number of free electrons should achieve 2.07 × 10²²
The number of charge carriers is measured using the Hall effect with two magnetic circuits with a magnetic field (Bmax = 0.7 T). A current of 6.7 mA.cm-2 is applied to the cathode sheet, and the Hall potential VH and constant RH are determined, leading to the charge carrier density or concentration (ccc) calculation (Experimental Section). The cccHall resulting from applying the Hall effect to a 1.6 × 2.0 cm2 NMC955 cathode with 57% LiNMC955+38% LPSCl+3% C65+2% SBR is directly comparable to the simulated cccsimulated of (LiNMC955) for different charged states [Figure 2B]. It should be noted that the cathode in the Hall effect and sheet resistance experiments is charged only with electrons, not with Li+-ions, as the cathode is not inserted into a battery cell. The simulations match the experiments; for the chemical potential µ =
The absolute chemical potential of the solid solution (LiNMC955) (coinciding with its Fermi level when electrically insulated with null surface potential) is µ0 = 4.15 V vs. Li0, corresponding to 2.74 × 10²¹ h+.cm-3
Note that the analyzed cathode contained 38% LPSCl electrolyte, a semiconductor with an electronic structure band gap energy of 2.5 eV[28], which may have been under-evaluated by DFT-GGA as traditionally occurs with semiconductors; the band gap may ascend to 4.2 eV. The cathode also contained 3% C65+2% SBR, but other materials besides the active cathode did not considerably affect the experimental results for
The cathode’s surface potential ϕcathode, measured by AFM with its scanning kelvin probe (SKP) mode, is
Materials characterization with SEM/energy-dispersive X-ray spectroscopy and atomic force microscopy/SKPM
The microstructure of the active material LiNMC955 in powder was analyzed by Scanning Electron Microscopy/Energy-Dispersive X-ray Spectroscopy (SEM/EDX) and presented in Figure 3A. The

Figure 3. Characterization of cathode materials. SEM/EDX images acquired with the BSE detector of (A) pure NMC955 powder at a magnification of 20,000; (B and C) cathode sample of 57% NMC955+38% Li6PS5Cl+3% C65+2% SBR at different magnifications 500 and 2,000×. Surface topography of cathode material using atomic force microscopy and SKPM; (D) 3D view; 2D electrochemical profile in (E) and 3D in (F). Note: the electrochemical potentials are plotted as analyzed vs. SHE (standard hydrogen electrode); to refer to Li0: Vνs Li0 =
To characterize the prepared cathode foil’s topography and surface chemical potential, an AFM with the ability to perform SKPM was used. The topography profile of the cathode is shown in Figure 3D, demonstrating that the cathode is uniform despite nanotopographic “peaks”. The corresponding electrochemical profile is shown in Figure 3E and F. As expected, there is no relationship between the topography [Figure 3D] and the electrochemical profile [Figure 3F] and Supplementary Figure 6. In the electrochemical profile [Figure 3F], charge accumulation regions with minimal amplitude can be observed between 0.155 V and -0.845 V vs. standard hydrogen electrode (SHE) [Figure 3E], corresponding to 3.205 V and 2.205 V vs. Li0. These results demonstrate that this cathode material exhibits quasi conductor-like behavior despite containing a significant proportion of the semiconductor LiPSCl electrolyte and the insulator SBR. In fact, the potential variation of the stripes in Figure 3E and F may indicate semiconductor behavior with a band gap approximately < 1 V [Figure 2A, D and E] for LiNMC955 between 2.6 V and 2.2 V. This observation aligns with the results obtained experimentally and simulated for the conductivity and DOS of the cathode [Figure 2C and D]. Another significant observation is that the average potential of this cathode sample is -0.35 V vs. SHE, 2.71 V vs. Li0, and -4.09 eV in the physical scale (absolute scale)[51] where the maximum chemical potential is zero for the electrons at rest in a surface in vacuum. The latter value is within the limit of the anode-cathode typical barrier[13,51].
Electrochemical characterization
The obtained cathode foils were used to assemble all-solid-state batteries with LPSCl as the electrolyte separator and lithium metal as an anode. All cells analyzed in this article are summarized in Supplementary Table 1. After assembly, the cells underwent electrical impedance spectroscopy (EIS) and cyclic voltammetry tests

Figure 4. Electrochemical characterization of a cell containing the 57% NMC955+ 38% Li6PS5Cl+3% C65+2% SBR cathode with active material Li0/Li6PS5Cl/NMC955. (A and B) PEIS and cyclic voltammetry analysis of the cell before the electrochemical cycling; (C) best electrochemical cycles for each C-rate; (D) cycles at C/10, C/5 and C; (E and F) Specific capacity vs. cycle number for charge and discharge, respectively, for the following C-rates: C/50, C/20, C/10, C/5, C/3, C/2, C, C/10, 2C, 3C, C/10, C/5, C/3, C/2, and C; (G and H) PEIS and cyclic voltammetry analysis of the cell after the electrochemical cycling. Cells tested at 25 C with no applied pressure; areal capacity of the cathode: 0.167 mAh.cm-2. Note: In E the lowest charging C-rate at CV varies from C/15 to C/76 for an average of C/46 and in F the lowest discharging average C-rate at CV is C/24. The maximum discharge capacity at C C-rate is > 120 mAh.g-1. SBR: Styrene-butadiene rubber; PEIS: potentiostatic electrochemical impedance spectroscopy; CV: constant voltage.
The cyclic voltammetry [Figure 4B] clearly show a pronounced reduction peak at 3.3 V while the cell is discharged. Notably, the current’s response sharply increases at ≥ 4.0 V, suggesting a shift in charge carrier origin
The cell was subjected to electrochemical cycles at different C-rates according to the estimated electrochemical limits. The theoretical specific capacity of the NMC cathode was considered 192 mAh.g-1 since only ~70% of the Li ions were allowed to be delithiated from the cathode material while charging[13]. The best cell performance for each of the implemented C-rates: C/50, C/20, C/10, C/5, C/3, C/2, C, 2C, and 3C are shown in Figure 4C. Based on the electrochemical cycles [Figure 4C], it is marked the significant stability in cell performance.
NMC955 cathode materials are prone to safety issues, such as thermal runaway, structural instability, and oxygen release due to the eminent presence of Ni2+[9,22]. Employing appropriate fabrication methods may help mitigate these risks by ensuring uniformity and minimizing the presence of impurities or defects that could trigger unwanted reactions under stressful conditions[22]. From the electrochemical performance in this study, it is evident that this cathode combination enables the creation of stable, long-lasting cells with unique performance, reaching the theoretical capacity multiple times for different C-rates, Figure 4D and Supplementary Figure 7A and B, showcasing a coulombic efficiency of ~100% considering the CV step in the electrochemical cycling [Supplementary Figure 7C]. Incorporating a CV step during both the charge and discharge stages is crucial for ensuring the cell’s long-term performance and little to no Ni2+ formed. The redox reactions for nickel are restricted to (Ni4+ ↔ Ni3+). This distinction becomes evident while analyzing the maximum discharge capacity obtained in the experiments shown in Figure 4E and F, Figure 5, and Supplementary Figure 7. At the charging process at higher C-rates, the cell’s capacity is achieved at CV, as shown in Figure 4E. The discharge at a constant current attains a higher capacity than the corresponding charging step [Figure 4F]. By including a final CV step, the cell repeatedly reaches its theoretical capacity at C for 130 cycles, for a total of 200 cycles. At C above cycle seventy, the lowest charge C-rate range obtained for the CV step was C/15 → C/76, for an average of C/46 [Figure 4E]. In fact, charging at C was found to be impossible above cycle 70, contrary to expectations, as charging is usually conducted faster than discharging in all-solid-state batteries. The average lowest C-rate for the discharge correspondent to the CV step was

Figure 5. Electrochemical cycling of two cells, Li0/Li6PS5Cl/NMC955, with a 57% NMC955+38% Li6PS5Cl+3% C65+2% SBR cathode simulated as (LiNMC955) = Li12Ni10MnCoO24 = LiNi0.833Mn0.083Co0.083O2 and (Li0.29NMC955) = Li7Ni20Mn2Co2O48 =
In Supplementary Figure 7C, the coulombic efficiency versus cycle number with and without the CV step was calculated considering the previous full charge. Otherwise, while cycling at C, where the charge obtained at constant current is almost null and, therefore, the charge is almost fully obtained at CV, the efficiency would always be > 100% for all cycles between 70 and 200 [Supplementary Figure 7A-C]. After completing the electrochemical cycles, PEIS and cyclic voltammetry tests were conducted
The direct comparison between experiments and stable solid solutions simulations is shown in Figure 5A, where all pinpoints and morphology of the electrochemical curves are observed and compared with the experiments for C/50 and C/10. The simulated capacity is calculated as the difference between the capacity at 2.60 V (lower voltage cut-off) and the capacity obtained when Li0.29NMC955 becomes the stable solid solution, at 4.05 V, which happens for a capacity of 10 mAh.g-1. Hence, the simulated capacity is
Pre/Post mortem TOF-SIMS analysis
TOF-SIMS is an advanced technique that provides detailed chemical and spatial information about the surfaces[53]. It works by bombarding the sample with a focused beam of high-energy ions, which release secondary ions that are analyzed to create a mass spectrum of the surface layers. By scanning the ion beam over the sample, spectra are obtained with the distribution of specific molecular species, or masses, from chosen areas of interest. In this study, TOF-SIMS was used to obtain molecular and spatial information about the degradation process of LPSCl/NMC955 composite cathodes[53]. Negative ion mass spectra of the cathode surface (acquired after sputter removal of the top surface, see Experimental section) displayed a multitude of peaks corresponding to secondary ions that can be associated with the different sample components, including NixOy- and CoxOy- ions representing the LiNMC955 discharged cathode material, Cl-, Sx- and PSx- ions representing the LPSCl electrolyte and CxH- ions representing the SBR binder.
Two cells were analyzed, a pristine and a cell that was cycled between 4.1 V and 2.6 V. The electrochemical profile of the cycled cell is shown in Supplementary Figure 3 and described in detail in Experimental Section. A comparison between the spectra from the uncycled pristine (“Fresh”) and cycled cathode samples revealed a strong intensity increase of the SO3- and SO4- peaks upon cycling, particularly when compared with the (less oxidized) S2O- and S3- ions, respectively [Figure 6A]. In contrast, the PS- and PO2- ions remained essentially unchanged upon cycling [Figure 6A]. These observations indicate that some of the most important chemical changes upon cycling are associated with oxidation of sulfur. Additionally, throughout the analysis, the oxidation of Mn3+ was not observed, even in the cycled samples. As indicated in Figure 2E, simulations indicate that manganese oxidation occurs above 4.1 V, where irreversible reactions occur. The absence of this oxidation in the analyzed samples highlights the importance of carefully defining charging limits and demonstrates how simulations are crucial in determining them.

Figure 6. TOF-SIMS analysis of “Fresh” (pristine) and cycled electrode samples. (A) Negative ion spectra of pristine and cycled electrode samples focusing on peaks corresponding to PS-/PO2- (left), S2O-/SO3- (center), and S3-/SO4- (right); (B) Ion images of secondary ions representing sulfates (top left), LiNMC955 (top right), LPSCl (bottom left) and SBR binder (bottom right); (C) Three-colour overlay image (from B) showing LPSCl in red, sulfates in green and LiNMC955 in blue. Field of view 100 × 100 µm2. TOF-SIMS: Time-of-flight secondary ion mass spectrometry; LPSCl: Li6PS5Cl.
The spatial distribution of the different components on the surface of the cycled cathode sample is visualized in the ion images [Figure 6B and C]. These images show a clear spatial separation between ions representing LPSCl and LiNMC955, respectively, indicating that the particles of these components are well separated on the sample surface and that their respective localization is confidently visualized in the ion images. Furthermore, the sulfate ion image reveals a close correlation with the LiNMC955 ion image, showing that the sulfates are mainly localized to the LiNMC955 particles. This is a strong indication that the sulfur oxidation, found to be associated with cycling, mainly occurs by sulfur diffusion to the LiNMC955 particles, rather than oxygen diffusion to the LPSCl particles. The latter assertion reinforces the necessity of not charging above 4.1 V to prevent the oxidation of Li0.3NMC955 avoiding reactions with sulfur, among other spurious reactions.
Pre/Post mortem Raman and calorimeter analysis
To evaluate the chemical and structural information of LiNMC955 cathodes fabricated by wet processing, Raman measurements were conducted on as prepared and cycled LiNMC955 electrodes [Figure 7A]. The Raman peak intensities were normalized on the highest peak intensity from LPSCl.

Figure 7. Analyses on pristine and post-mortem cycled cells. (A) Raman spectroscopy analysis as-prepared (pristine) and cycled cathode material; (B) Heat flow analysis on cell from Figure 4 at 30 °C considering different cycling states: (1) OCV (without external resistor), (2) Rext = 217 kΩ, (3) OCV, and (4) Rext = 553 kΩ. Schematics of the battery calorimeter set up on the right. OCV: Open circuit voltage.
The main vibration modes for LPSCl show up as a prominent signal at 423 cm-¹, due to the symmetric stretching of (PS43-), along with additional peaks at 197 cm-¹ and 265 cm-¹ and a band between ~500 cm-1 and 600 cm-1, which come from asymmetric stretching of (PS43-), as explained by Taklu et al.[54]. For LiNMC955, most Raman-active vibrations are found in the 400-600 cm-1 range, with a strong signal approximately ~570 cm-1 from the A1g mode of Ni, as reported by Li et al.[55]. There are also smaller signals between ~470 cm-1 and 610 cm-1. A broader signal appears between ~1,200 cm-1 and 1,700 cm-1 where the presence of D and G bands arising from the carbon materials are observed[56-58], which could come from the carbon-coated aluminum foil supporting the cathode or from the conductive filler. This variety makes it difficult to pinpoint the exact source of these signals.
By analyzing Figure 7A, it becomes clear that most signals from the cathode’s main components overlap in the 500-600 cm-1 range, making it challenging to assign these peaks specifically to the active material or the argyrodite phase, a common issue in the literature[56,59,60]. Even so, the main signal from the argyrodite phase remains clearly visible in both the as-prepared and cycled Raman spectra, confirming its presence in the cathode composite, already demonstrated with TOF-SIMS. Interestingly, the as-prepared cathode shows a stronger signal for the LiNMC955 phase at ~570 cm-1 compared to the cycled version, which shows a lower overall intensity in the 500-600 cm-1 band. This difference may be due to degradation of the cathode material during cycling, reacting with the argyrodite LiPSCl, or to the potential damage while removing the cycled cathode from the pellet. In fact, the difference may be due to the formation of SO3- and SO4- on the surface of LiNMC955, as shown by TOF-SIMS in Figure 6. The calorimeter analysis on the cell from Figure 4 obtained while discharging from 3.7 V shows that the higher the discharge current the greater the amount of heat released [Figure 7B]. This may indicate that oxygen is mostly released immediately after the beginning of discharge at higher C-rates (exothermic reaction), as shown in the inset of Figure 4B. More than 2.2 h are necessary to start stabilizing the heat flow at ~C/5, with the first hour corresponding to a pronounced exothermic variation of 14.6 μW.
CONCLUSIONS
This study demonstrates the effectiveness of the NMC955 cathode, prepared using a novel simulation-supported wet preparation method, in a Li0/LPSCl/NMC955 all-solid-state cell. The cell operates efficiently at room temperature without additional interlayers or applied pressure. A cost-effective and environmentally friendly binder, SBR, was employed as an alternative to traditional PVDF, enhancing processability while maintaining performance, thereby providing a viable preparation method for all-solid-state lithium batteries.
The proposed cathode enables stable and long-lasting cell performance, achieving theoretical capacities across various C-rates (C/50 → 3C) and sustaining a high-rate capability for C. This was made possible through the inclusion of a CV step during both charge and discharge, which showcased a near 100% coulombic efficiency over 200 cycles. The first 70 cycles spanned a wide range of C-rates, while the remaining 130 cycles were conducted at C C-rate, all at 25 °C without applied pressure. This methodology emphasizes the importance of conditioning and battery management systems grounded in theoretical studies to advance efficiency and high-rate performance.
Theoretical insights, supported by simulations of chemical potential versus charge carrier density and DOS for LiNMC955 and Li0.3NMC955, demonstrated that tailored cycling protocols significantly extend cycle life. The approach minimizes oxygen release and its reaction with LPSCl, reduces overcharge-induced sulfur and sulfate formation, and avoids the formation of detrimental Mn3+ and Ni2+ during over-discharge. This ensures the structural integrity of the cathode and eliminates the adverse effects of the Mn3+/4+ redox pair, while leveraging the stabilizing influence of the Co3+/4+ redox couple.
Advanced analytical techniques, including sheet resistance/Hall effect, atomic force microscopy/SKPM, TOF-SIMS, Raman spectroscopy, and battery calorimetry, complemented the electrochemical and SEM/EDX analyses, providing robust validation of the findings. These methods clarified the pivotal role of the cathode in shaping the electrochemical cycle and determining the cycle life of the Li0/LPSCl/NMC955 all-solid-state battery.
The results position NMC955 as a sustainable and high-performance cathode material for next-generation solid-state batteries, offering a pathway to high-power and high-energy-density solutions while deviating from environmentally unsustainable components. This study highlights the value of “following the electrons” to derive quantitative and qualitative insights, enabling optimized cycling protocols and advancing the design of solid-state battery systems.
DECLARATIONS
Authors’ contributions
Conceptualization: Gomes, B. M.; Baptista, M. C.; Orue, A.; Braga, M. H.
Data collection: Gomes, B. M.; Baptista, M. C.; Terlicka, S.; Orue, A.; Dhrubajyoti, B.; Sjövall, P.;
Data analysis: Gomes, B. M.; Baptista, M. C.; Orue, A.; Dhrubajyoti, B.; Braga, M. H.
Simulations: Braga, M. H.
Writing-original draft: Gomes, B. M.; Baptista, M. C.; Terlicka, S.; Orue, A.; Dhrubajyoti, B.; Braga, M. H.
Funding acquisition: Orue, A.; Smajic, J.; Kekkonen, V.; Vonk, W.; Tron, A.; Braga, M. H.; Ahniyaz, A.
Supervision: Braga, M. H.
State-of-the-art insights, writing-review, editing, and approval of final version: Gomes, B. M.;
Availability of data and materials
All datasets generated for this study are included in the article/Supplementary Materials.
Financial support and sponsorship
This project has received funding from the European Union’s Horizon Europe research and innovation programme under grant agreement No. 101069686 (PULSELiON). Views and opinions expressed are those of the authors only and do not necessarily reflect those of the European Union or CINEA. Neither the European Union nor the granting authority can be held responsible.
Conflicts of interest
All authors declared that there are no conflicts of interest.
Ethical approval and consent to participate
Not applicable.
Consent for publication
Not applicable.
Copyright
© The Author(s) 2025.
Supplementary Materials
REFERENCES
1. Randau, S.; Weber, D. A.; Kötz, O.; et al. Benchmarking the performance of all-solid-state lithium batteries. Nat. Energy. 2020, 5, 259-70.
2. Hou, D.; Xu, Z.; Yang, Z.; et al. Effect of the grain arrangements on the thermal stability of polycrystalline nickel-rich lithium-based battery cathodes. Nat. Commun. 2022, 13, 3437.
3. Chen, S.; Wen, K.; Fan, J.; Bando, Y.; Golberg, D. Progress and future prospects of high-voltage and high-safety electrolytes in advanced lithium batteries: from liquid to solid electrolytes. J. Mater. Chem. A. 2018, 6, 11631-63.
4. Vinayak, A. K.; Li, M.; Huang, X.; et al. Circular economies for lithium-ion batteries and challenges to their implementation. Next. Mater. 2024, 5, 100231.
5. Man, Q.; An, Y.; Shen, H.; et al. MXenes and their derivatives for advanced solid-state energy storage devices. Adv. Funct. Mater. 2023, 33, 2303668.
6. Tron, A.; Hamid, R.; Zhang, N.; Beutl, A. Rational optimization of cathode composites for sulfide-based all-solid-state batteries. Nanomaterials 2023, 13, 327.
7. Liu, W.; Li, D.; Liu, Y.; Luo, D.; Xu, R. A critical review of single-crystal LiNixMnyCo1-x-yO2 cathode materials. Renewables 2024, 2, 25-51.
8. Bin, A. S. A. D. A.; Imaduddin, I. S.; Majid, S.; et al. Nickel-rich nickel-cobalt-manganese and nickel-cobalt-aluminum cathodes in lithium-ion batteries: Pathways for performance optimization. J. Cleaner. Prod. 2024, 435, 140324.
9. Saaid, F. I.; Kasim, M. F.; Winie, T.; et al. Ni-rich lithium nickel manganese cobalt oxide cathode materials: a review on the synthesis methods and their electrochemical performances. Heliyon 2024, 10, e23968.
10. Das, D.; Manna, S.; Puravankara, S. Electrolytes, additives and binders for NMC cathodes in Li-ion batteries-a review. Batteries 2023, 9, 193.
11. Wang, Q.; Wang, Z.; Li, X.; Zhu, Y.; Gao, P. Synthesis and characterization of Co-free NMA cathodes for fast charging lithium-ion batteries. J. Alloys. Compd. 2023, 955, 170226.
12. Li, W.; Lee, S.; Manthiram, A. High-Nickel NMA: a cobalt-free alternative to NMC and NCA cathodes for lithium-ion batteries. Adv. Mater. 2020, 32, 2002718.
13. Maia, B. A.; Gomes, B. M.; Guerreiro, A. N.; Santos, R. M.; Braga, M. H. Cathodes pinpoints for the next generation of energy storage devices: the LiFePO4 case study. J. Phys. Mater. 2024, 7, 025001.
14. Baptista, M. C.; Gomes, B. M.; Capela, D.; et al. Conditioning solid-state anode-less cells for the next generation of batteries. Batteries 2023, 9, 402.
15. Braga, M. H.; Stockhausen, V.; Oliveira, J. C.; Ferreira, J. A. The role of defects in Li3ClO solid electrolyte: calculations and experiments. MRS. Online. Proceedings. Library. 2013, 1526, 905.
16. Baptista, M. C.; Gomes, B. M.; Vale, A. B.; Braga, M. H. In-series all-solid-state anode-less cells. J. Energy. Storage. 2024, 102, 113983.
17. Li, S.; Meng, X.; Yi, Q.; et al. Structural and electrochemical properties of LiMn0.6Fe0.4PO4 as a cathode material for flexible lithium-ion batteries and self-charging power pack. Nano. Energy. 2018, 52, 510-6.
18. Gu, H.; Li, W.; Li, Q.; et al. Electrochemical properties of Li4Ti5O12 coated LiMn0.6Fe0.4PO4 prepared by rheological phase reaction method. J. Electrochem. Soc. 2024, 171, 040502.
19. Nguyen, M. T.; Pham, H. Q.; Berrocal, J. A.; Gunkel, I.; Steiner, U. An electrolyte additive for the improved high voltage performance of LiNi0.5Mn1.5O4 (LNMO) cathodes in Li-ion batteries. J. Mater. Chem. A. 2023, 11, 7670-8.
20. Jiang, H.; Zeng, C.; Zhu, W.; et al. Boosting cycling stability by regulating surface oxygen vacancies of LNMO by rapid calcination. Nano. Res. 2024, 17, 2671-7.
21. Hofmann, A.; Höweling, A.; Bohn, N.; Müller, M.; Binder, J. R.; Hanemann, T. Additives for cycle life improvement of high-voltage LNMO-based Li-ion cells. ChemElectroChem 2019, 6, 5255-63.
22. Malik, M.; Chan, K. H.; Azimi, G. Review on the synthesis of LiNixMnyCo1-x-yO2 (NMC) cathodes for lithium-ion batteries. Mater. Today. Energy. 2022, 28, 101066.
24. Noerochim, L.; Suwarno, S.; Idris, N. H.; Dipojono, H. K. Recent development of nickel-rich and cobalt-free cathode materials for lithium-ion batteries. Batteries 2021, 7, 84.
25. Xu, C.; Märker, K.; Lee, J.; et al. Bulk fatigue induced by surface reconstruction in layered Ni-rich cathodes for Li-ion batteries. Nat. Mater. 2021, 20, 84-92.
26. Kim, U.; Kuo, L.; Kaghazchi, P.; Yoon, C. S.; Sun, Y. Quaternary layered Ni-rich NCMA cathode for lithium-ion batteries. ACS. Energy. Lett. 2019, 4, 576-82.
27. Emley, B.; Wu, C.; Zhao, L.; et al. Impact of fabrication methods on binder distribution and charge transport in composite cathodes of all-solid-state batteries. Mater. Futures. 2023, 2, 045102.
28. Gomes, B. M.; Ribeiro, M. J. F.; Braga, M. H. A perspective on the building blocks of a solid-state battery: from solid electrolytes to quantum power harvesting and storage. J. Mater. Chem. A. 2024, 12, 690-722.
29. Yu, C.; Ganapathy, S.; Hageman, J.; et al. Facile synthesis toward the optimal structure-conductivity characteristics of the argyrodite Li6PS5Cl solid-state electrolyte. ACS. Appl. Mater. Interfaces. 2018, 10, 33296-306.
30. Nikodimos, Y.; Huang, C.; Taklu, B. W.; Su, W.; Hwang, B. J. Chemical stability of sulfide solid-state electrolytes: stability toward humid air and compatibility with solvents and binders. Energy. Environ. Sci. 2022, 15, 991-1033.
31. Wang, Z.; Xia, J.; Ji, X.; et al. Lithium anode interlayer design for all-solid-state lithium-metal batteries. Nat. Energy. 2024, 9, 251-62.
32. Liu, Y.; Wang, C.; Yoon, S. G.; et al. Aluminum foil negative electrodes with multiphase microstructure for all-solid-state Li-ion batteries. Nat. Commun. 2023, 14, 3975.
33. Zhong, X.; Han, J.; Chen, L.; et al. Binding mechanisms of PVDF in lithium ion batteries. Appl. Surf. Sci. 2021, 553, 149564.
34. Cordner, A.; Brown, P.; Cousins, I. T.; et al. PFAS Contamination in europe: generating knowledge and mapping known and likely contamination with “expert-reviewed” journalism. Environ. Sci. Technol. 2024, 58, 6616-27.
35. Sonne, C.; Jenssen, B. M.; Rinklebe, J.; et al. EU need to protect its environment from toxic per- and polyfluoroalkyl substances. Sci. Total. Environ. 2023, 876, 162770.
36. Singer, C.; Schmalzbauer, S.; Daub, R. Influence of the slurry composition on thin-film components for the wet coating process of sulfide-based all-solid-state batteries. J. Energy. Storage. 2023, 68, 107703.
37. Gao, J.; Hao, J.; Gao, Y.; et al. Scalable wet-slurry fabrication of sheet-type electrodes for sulfide all-solid-state batteries and performance enhancement via optimization of Ni-rich cathode coating layer. eTransportation 2023, 17, 100252.
38. Ruhl, J.; Riegger, L. M.; Ghidiu, M.; Zeier, W. G. Impact of solvent treatment of the superionic argyrodite Li6PS5Cl on solid-state battery performance. Adv. Energy. Sustain. Res. 2021, 2, 2000077.
39. Tan, D. H. S.; Banerjee, A.; Deng, Z.; et al. Enabling thin and flexible solid-state composite electrolytes by the scalable solution process. ACS. Appl. Energy. Mater. 2019, 2, 6542-50.
40. Rolandi, A. C.; de, M. I.; Casado, N.; Forsyth, M.; Mecerreyes, D.; Pozo-gonzalo, C. Unlocking sustainable power: advances in aqueous processing and water-soluble binders for NMC cathodes in high-voltage Li-ion batteries. RSC. Sustain. 2024, 2, 2125-49.
41. Demiryürek, R.; Gürbüz, N.; Hatipoglu, G.; et al. Roll-to-roll manufacturing method of aqueous-processed thick LiNi0.5Mn0.3Co0.2O2 electrodes for lithium-ion batteries. Int. J. Energy. Res. 2021, 45, 21182-94.
42. Surace, Y.; Jahn, M.; Cupid, D. M. The rate capability performance of high-areal-capacity water-based NMC811 electrodes: the role of binders and current collectors. Batteries 2024, 10, 100.
43. Isozumi, H.; Kubota, K.; Tatara, R.; et al. Impact of newly developed styrene-butadiene-rubber binder on the electrode performance of high-voltage LiNi0.5Mn1.5O4 electrode. ACS. Appl. Energy. Mater. 2020, 3, 7978-87.
44. Yabuuchi, N.; Kinoshita, Y.; Misaki, K.; Matsuyama, T.; Komaba, S. Electrochemical properties of LiCoO2 electrodes with latex binders on high-voltage exposure. J. Electrochem. Soc. 2015, 162, A538.
45. Wu, Q.; Ha, S.; Prakash, J.; Dees, D. W.; Lu, W. Investigations on high energy lithium-ion batteries with aqueous binder. Electrochim. Acta. 2013, 114, 1-6.
46. Kasnatscheew, J.; Börner, M.; Streipert, B.; et al. Lithium ion battery cells under abusive discharge conditions: electrode potential development and interactions between positive and negative electrode. J. Power. Sources. 2017, 362, 278-82.
47. Dose, W. M.; Xu, C.; Grey, C. P.; De, V. M. F. Effect of anode slippage on cathode cutoff potential and degradation mechanisms in Ni-rich Li-ion batteries. Cell. Rep. Phys. Sci. 2020, 1, 100253.
48. Zhang, S. S. The effect of the charging protocol on the cycle life of a Li-ion battery. J. Power. Sources. 2006, 161, 1385-91.
49. Kresse, G.; Hafner, J. Ab initio molecular dynamics for liquid metals. Phys. Rev. B. 1993, 47, 558.
50. Perdew, J. P.; Wang, Y. Accurate and simple analytic representation of the electron-gas correlation energy. Phys. Rev. B. 1992, 45, 13244-9.
51. Trasatti, S. The absolute electrode potential: an explanatory note (Recommendations 1986). Pure. Appl. Chem. 1986, 58, 955-66.
52. Nipan, G. D. Isobaric-isothermal polyhedra of solid solutions in the Li-Ni-Mn-Co-O system. Inorg. Mater. 2021, 57, 518-23.
53. Walther, F.; Koerver, R.; Fuchs, T.; et al. Visualization of the interfacial decomposition of composite cathodes in argyrodite-based all-solid-state batteries using time-of-flight secondary-ion mass spectrometry. Chem. Mater. 2019, 31, 3745-55.
54. Taklu, B. W.; Su, W.; Nikodimos, Y.; et al. Dual CuCl doped argyrodite superconductor to boost the interfacial compatibility and air stability for all solid-state lithium metal batteries. Nano. Energy. 2021, 90, 106542.
55. Li, X.; Chang, K.; Abbas, S. M.; et al. Silver nanocoating of LiNi0.8Co0.1Mn0.1O2 cathode material for lithium-ion batteries. Micromachines 2023, 14, 907.
56. Byeon, Y.; Yang, S.; Yang, G.; et al. Conductive carbon embedded beneath cathode active material for longevity of solid-state batteries. J. Mater. Chem. A. 2024, 12, 8359-69.
57. Jung, Y. H.; Lim, C. H.; Kim, D. K. Graphene-supported Na3V2(PO4)3 as a high rate cathode material for sodium-ion batteries. J. Mater. Chem. A. 2013, 1, 11350-4.
58. Araño, K. G.; Yang, G.; Armstrong, B. L.; et al. Carbon coating influence on the formation of percolating electrode networks for silicon anodes. ACS. Appl. Energy. Mater. 2023, 6, 11308-21.
59. Nam, J. S.; To, A. R. W.; Lee, S. H.; et al. Densification and charge transport characterization of composite cathodes with single-crystalline LiNi0.8Co0.15Al0.05O2 for solid-state batteries. Energy. Storage. Mater. 2022, 46, 155-64.
Cite This Article
 , ... Maria Helena Braga
How to Cite
Download Citation
Export Citation File:
Type of Import
Tips on Downloading Citation
Citation Manager File Format
Type of Import
Direct Import: When the Direct Import option is selected (the default state), a dialogue box will give you the option to Save or Open the downloaded citation data. Choosing Open will either launch your citation manager or give you a choice of applications with which to use the metadata. The Save option saves the file locally for later use.
Indirect Import: When the Indirect Import option is selected, the metadata is displayed and may be copied and pasted as needed.
About This Article
Copyright


Comments
Comments must be written in English. Spam, offensive content, impersonation, and private information will not be permitted. If any comment is reported and identified as inappropriate content by OAE staff, the comment will be removed without notice. If you have any queries or need any help, please contact us at [email protected].