
Motivation, preference, and willingness of Chinese consumers to purchase carbon-labeled eggs
 0
0 Abstract
Promoting carbon labels for agricultural products has crucial practical value in reducing carbon emissions. Based on the binary logit model, this paper studied the different motivations of consumers in eastern, central, and western China to purchase carbon-labeled eggs. Based on the choice experiment method and mixed logit model, this paper investigates the preferences and willingness of consumers in different regions to pay for different attributes of carbon-labeled eggs. The results show that the motives driving consumers in different regions to buy carbon-labeled eggs vary but are mainly taking a wait-and-see approach. Consumers in the eastern, central, and western regions all strongly prefer low-carbon labeled eggs. In contrast, consumers in the western region have no significant positive preference for medium-carbon labels. The combination of low-carbon labels and free-range labels has a complementary effect on consumer groups in the eastern, central, and western regions. Low-carbon labels and organic certification labels have a substitutive effect on consumer groups in the eastern region. Medium-carbon labels, organic certification labels, low-carbon labels, and docosahexaenoic acid (DHA) -enriched egg labels have a complementary effect on consumer groups in eastern and central regions. In contrast, medium-carbon labels and DHA-enriched egg labels have a substitutive effect. The willingness to purchase carbon-labeled eggs is lower for older consumers in the eastern region and families with a heavier burden of elderly care and children in the central region.

Keywords
INTRODUCTION
The global food system is responsible for 34% of current global anthropogenic greenhouse gas (GHG) emissions, with 40% of these emissions attributed to the agricultural phase[1]. As part of the agricultural phase, livestock accounts for 14.5% of global greenhouse gas emissions, which is a big proportion of the total emissions[2]. Eggs are an important component of the poultry supply chain, with 1 kg of eggs producing
Carbon label is a quantitative indicator on product labels that indicates the amount of greenhouse gases emitted during the production process of a product[8]. It is an important means of forcing industries to achieve carbon reduction from the consumer side. Purchasing 40 low-carbon products per week is estimated to reduce personal carbon emissions by 10%[9]. Meanwhile, it may promote the sales of related products[10]. The world's first carbon label was born in 2008[11]. Now it has been promoted in many developed countries and regions and has derived many types and forms. Some popular ones include the traffic-light labels (the carbon footprint increases from green to yellow to red)[12] and carbon neutral labels (the carbon emissions have been fully offset)[13,14]. Different carbon label designs also impact consumers' information processing. A UK study found that consumers prefer labels communicating the overall climate impact rather than intra-category comparisons[15]. Carbon labeling got started relatively late in mainland China. In November 2018, a pilot carbon label program was officially launched and mainly targeted electrical and electronic products and services[16]. Chinese consumers have shown a positive attitude towards carbon labeling, which provides conditions for promoting carbon labeling in China[17]. As an emerging product in China, carbon-labeled eggs have not yet been widely launched. Some other carbon-labeled products, such as “beverages”, “hamburgers”, and “dairy products” have been researched and promoted on a small scale in the market[18-20], providing many promotion suggestions and feasible policies, which is meaningful for the research of carbon-labeled eggs.
The first step in understanding consumer demand is to study the motives and influencing factors of consumers purchasing carbon-labeled products and other low-carbon products. From the perspective of individual consumer characteristics, it is generally believed that income level, education level, and degree of awareness of carbon-labeled products have a positive impact on the behaviour of purchasing carbon-labeled products and low-carbon products[8,16]. Some research also believes that gender and family are potential factors influencing consumers' purchase of carbon-labeled products[17,21]. From the perspective of the product itself, some research believes that consumers place importance on whether a product is carbon-labeled and low-carbon after price attributes, and the affordable price remains consumers' top priority[22]. Some research has also shown that compared to carbon labeling and being low-carbon, consumers pay more attention to the safety attributes of products, such as organic or free range[23]. Regarding the investigation of consumers’ motivations for purchasing carbon labels and low-carbon products, various scholars have studied from multiple perspectives, with research focusing on aspects such as low-carbon awareness, perceived benefits, and interpersonal environment. The research found that people with high low-carbon awareness and high perceived benefits tend to be more motivated to purchase[14,24,25]. In addition to the above perspectives, Yao et al. research also examines the impact of government, businesses, and media on consumers' purchasing behavior toward carbon-labeled products[26]. The study emphasizes the importance of building consumer trust through regulation and oversight, as well as consumers' disadvantaged position in situations of information asymmetry.
Leveraging the complementary effect between carbon labeling and other attributes of eggs may be an important approach to promoting carbon-labeled eggs. Discrete choice experiments can reveal consumers' trade-offs and choices when purchasing goods through multiple choice tasks of consumers, to explore consumers' preferences for product attributes, facilitate understanding of current purchasing behaviors, and predict future choices, thereby making discrete choice experiments a commonly used method in food research[27]. Additionally, the choice experiment is an effective method to explore the interaction of labels. Previous studies on other labeled products can support this view: Liu et al. conducted choice experiments on labels such as geographical origin declarations and government food safety identifications, finding strong complementary effects between some geographical origin declarations and government certifications[28]. Aoki and Akai applied choice experiments to explore the different preferences of Japanese and Spanish consumers for strawberries[29]. They found that Japanese respondents preferred red, sweet, organic strawberries grown using solar or woody biomass power at an affordable price, while Spanish respondents preferred less sour strawberries. In addition to choice experiments, contingent valuation methods and scenario experiments are often used to study consumer preferences for carbon labels and low-carbon products[21,25]. However, contingent valuation methods cannot investigate the relationships between attributes compared to choice experiments.
Existing literature offers substantial theoretical and empirical groundwork on carbon labeling influences, low-carbon products, and consumers' premium willingness. However, there are still some problems. Currently, the promotion of carbon-labeled products in China has not yet achieved nationwide implementation, remaining limited to pilot programs in select enterprises and regions. For instance, Shaoxing City in Zhejiang Province has initiated carbon label pilot projects in 15 textile enterprises, while Huai'an City in Jiangsu Province is advancing carbon label certification trials for salt chemical products. The promotion of carbon labels for agricultural products remains in its nascent stage. Nevertheless, the adoption of carbon-labeled products represents a crucial measure for facilitating low-carbon transformation within food systems and achieving dual-carbon goals. Investigating consumers' willingness to pay (WTP) for such products constitutes essential preliminary work. Beyond these considerations, our review of existing literature reveals that current food labeling research primarily focuses on nutritional value, with comparatively limited attention to environmental impacts. Therefore, this study selects carbon-labeled eggs as its research subject, aiming to comprehensively examine regional variations in consumers' purchasing motivations, preferences, and WTP for carbon labels. Based on our findings, we will propose targeted promotion strategies and practical application scenarios. This research seeks to establish foundational knowledge for carbon label dissemination and contribute to emission reduction efforts.
The whole paper is organized as below. After the introduction section, Section "METHOD" depicts research methods and data. Section "RESULTS AND DISCUSSION" presents the research results and discussion. Section "ROBUSTNESS CHECK" conducts robustness checks. Section "CONCLUSIONS AND POLICY IMPLICATIONS" draws research conclusions and policy implications.
METHOD
Motivational exploration experimental design
This paper designed 20 items as topics for the Likert scale. The KMO value of the scale data was 0.934 > 0.6, and the significance level was 0.000 (< 0.01), indicating that the questionnaire has a good factor structure and is suitable for factor analysis. Through factor analysis, five dimensions were divided, excluding one dimension measured by only two items and excluding items with loadings greater than 0.5 in two factors in the remaining dimensions, and re-factor analysis was performed. Finally, four dimensions were obtained, with each dimension measured by three items and named according to the item implications: “Environmental motives", “Trust motives”, “Social motives”, and “Adventure motives”. the meanings of the four motives are different. Specifically, “Environmental motives” mainly measure the degree to which consumers' environmental awareness affects their willingness to purchase carbon-labeled agricultural products; “Trust motives” mainly measure consumers' degree of trust in whether carbon-labeled products can improve the environment; “Social motives” mainly measure the degree of influence of consumers' family and friends; “Adventure motives” focus on measuring consumers' novelty-seeking awareness and caution. The specific division is shown in Table 1. A simple scoring statistic was conducted, with the score of each dimension reflected by the average of the three items.
Comparison of consumer motivation scores among eastern, central, and western consumers
| Eastern region | Central region | Western region | |||||
| Mean | Standard deviation | Mean | Standard deviation | Mean | Standard deviation | ||
| Environmental motives | When buying things, I would consider whether their use would impact the environment or other consumers | 4.08b | 0.80 | 4.07c | 0.75 | 3.92bc | 0.68 |
| I am willing to make personal sacrifices to improve environmental quality (such as buying more expensive but lower carbon products, going out less by car and more by walking, etc.), even if it cannot produce immediate visible effects in the short term | |||||||
| I believe purchasing low-carbon products is beneficial for raising environmental protection awareness in society and improving the environmental quality around us | |||||||
| Trust motives | In my view, purchasing products with carbon labels can reduce carbon dioxide emissions from that industry, thereby helping protect the environment | 4.11b | 0.78 | 4.06 | 0.80 | 3.95b | 0.69 |
| I believe products with carbon labels are safe, reliable, and worthy of trust | |||||||
| I would recommend carbon-labeled products to my family or friends | |||||||
| Social motives | My family's shopping habits (such as my family members' consumption concepts) would influence my decisions when I shop | 3.90 | 0.75 | 3.88 | 0.71 | 3.83 | 0.68 |
| Compared to ordinary products, my friends are more willing to purchase low-carbon products | |||||||
| I would take friends' advice into account when shopping | |||||||
| Adventure motives | Generally speaking, when I see new products on the shelves, I am one of the first people to purchase them | 3.57b | 0.83 | 3.54 | 0.79 | 3.44b | 0.84 |
| Purchasing products with carbon labels can satisfy my sense of novelty and curiosity | |||||||
| I would fully understand the relevant information on carbon labels before choosing to purchase after shopping | |||||||
From the average scores and independent-sample t-test results of the four motives, it can be seen that there is no significant difference in the scores of the four motives between the eastern and central regions. Consumers in eastern China demonstrate significantly stronger environmental, trust, and adventure motives than their central/western counterparts, suggesting greater environmental awareness, trust in carbon labels, and risk acceptance capacity. Compared with western regions, central region consumers have significantly higher environmental motives, indicating that central region consumers may have higher environmental awareness than western region consumers.
Discrete choice experiment design
For the selection of attributes and levels, this study determines the attributes and levels of carbon-labeled eggs by combining on-site investigations, online shopping malls, and relevant literature research on eggs. According to Panzone et al., the carbon label attributes are divided into low-carbon, medium-carbon, and high-carbon three levels with traffic-light style[30]. In the process of determining other important attributes of eggs, we found that the high-end eggs sold in offline supermarkets are mainly organic, free-range eggs, and naturally-fed eggs. Previous research on eggs also focused on aspects such as organic certification of eggs, feeding methods, and breeding methods[31-33]. Therefore, the organic certification attribute, feeding method attribute, and breeding method attribute are selected as the research objects. Existing studies have shown that docosahexaenoic acid (DHA) -enriched eggs contain more nutrients that help brain development. With the increasing demand for more nutritious eggs, DHA eggs are becoming a hotspot for online sales[34]. Therefore, it is also considered as a research object. In addition, to measure consumers' WTP variation across different attributes, four price levels were also taken into consideration with a comprehensive reference to the recent average market prices of different eggs. The attributes and levels for the choice experiment are shown in Table 2.
Egg attributes and corresponding levels
| Attributes | Levels | Description of attributes |
| Carbon label | Low-carbon label | Carbon labeling of greenhouse gas emissions (in CO2e) per egg produced |
| Medium-carbon label | ||
| High-carbon label | ||
| Hen breeding method | Free-range raising | Breeding of laying hens |
| Cage raising | ||
| Hen feeding method | Natural food feed | For laying hen feed, natural foods refer to corn, wheat, soybeans, vegetables, and other crops |
| Conventional feed | ||
| Organic certification | Organic certification | Whether there is an organic certification mark on the egg package |
| Non-organic certification | ||
| DHA-enriched | DHA-enriched | The eggs are fortified with DHA (docosahexaenoic acid) |
| Non-DHA enriched | ||
| Price | 1.20; 2.47; 3.73; 5.00 | Price per egg (¥ per egg) |
This paper uses the create command in STATA 17.0 to conduct an orthogonal design for the choice experiment. According to the set attributes and levels, the full factorial orthogonal design should have 192 (3 × 2 × 2 × 2 × 2 × 4) variations. While considering setting three different carbon-labeled eggs in each choice set, consumers would face 6,967, 680 choices, which is difficult to implement and would greatly increase consumers' choice burden. Therefore, we limit the design to six versions, with six questions assigned to each version and three options designed for each question so that each consumer only needs to choose from eighteen options. Figure 1 shows a choice experiment task.

Figure 1. Example of a choice task.
Variable selection and coding
The selection of variables for the motivation exploration and choice experiment sections was completed in the previous two parts. In addition to considering the variables from the above two parts, this paper also adds consumers' characteristics to explore their impact on consumers' purchase of carbon-labeled eggs. Referring to previous studies, the selected individual characteristics include gender, age, education level, personal monthly income, and whether there are minors or people over 60 years old at home.
For the variable coding of the choice experiment attribute preference section, this paper refers to John Cranfield’s study by adopting effect coding[35], while dummy coding and sequential coding are used for other parts. Effect coding has the following advantages over dummy coding: it makes the constant term of the regression model equal to the overall average, enables better interpretation and comparison, and better reflects the degree of influence of qualitative factors, making the estimates of main effects and interaction effects more reasonable. In contrast, although dummy coding can well estimate interaction effects, too many dummy variables may cause multicollinearity problems, thereby masking the main effects in the interaction item model and making the main effects difficult to interpret after introducing interaction items[36]. The specific variable definitions are shown in Table 3.
Variable coding and labeling
| Variables | Notation | Variable definition and coding |
| Low-carbon label | LOW | LOW = 1, MED = 0 |
| Medium-carbon label | MED | LOW = 0, MED = 1 |
| High-carbon label | HIG | LOW = -1, MED = -1 |
| Free-range raising | FREE | FREE = 1 |
| Cage raising | CAGE | FREE = -1 |
| Natural food feed | NATU | NATU = 1 |
| Conventional feed | FEED | NATU = -1 |
| Organic certification | ORG | ORG = 1 |
| Non-organic certification | NOORG | ORG = -1 |
| DHA-enriched eggs | DHA | DHA = 1 |
| Non-DHA-enriched eggs | NODHA | DHA = -1 |
| Price (RMB/piece) | PRICE | PRICE = 1.20; 2.47; 3.73; 5.00 |
| Gender | GEN | Male = 0, Female = 1 |
| Age | AGE | (0, 18] = 1; (18,28] = 2; [29, 39] = 3; [40, 50] = 4; [51,61) = 5; [61, +∞] = 6 |
| Highest education | EDU | Elementary school = 1; Middle school = 2; High school = 3; Undergraduate = 4; Postgraduate = 5 |
| Monthly personal income (¥) | INCOME | (0, 3,000] = 1; (3,000, 5,000] = 2; [5,001, 10,000] = 3; [10,001, 20,000] = 4; [20,001, 30,000] = 5; [30,001, 40,000] = 6; [40,001, 50,000] = 7; (50,000, +∞) = 8 |
| Whether there are minors or people over sixty years old | STRUCTURE | =1 if there are; =0 if there aren’t |
| Environmental motives | ENVIRONMENT | Each motivator is measured by three 5-point scale items: |
| Trust motives | TRUST | |
| Social motives | SOCIAL | |
| Adventure motives | RISK |
Econometric models
Binary logit model
In the part of studying consumers' motivations for purchasing carbon-labeled eggs, this paper uses “whether consumers are willing to purchase carbon-labeled eggs” as the dependent variable. This variable is dichotomous, so the multivariate linear regression model is no longer applicable. The binary logistic regression model is suitable for this part. Taking 1 as the value for being willing to purchase carbon-labeled eggs and 0 as the value for being unwilling to purchase carbon-labeled eggs, the following model can be constructed:
where Pi is the probability of being willing to purchase carbon-labeled eggs, α0 is constant. αi (i = 1, 2, 3, 4) is the coefficient for the four motivators, and ui is a random disturbance.
Mixed logit model
Choice experiment methods often use logit models. The mixed logit model relaxes the restriction of the multinomial logit model that random error terms must strictly follow the IID assumption. It allows parameters to vary randomly across individuals and can conduct heterogeneity analysis of choice preferences. Compared to the conditional logit model, where explanatory variables cannot vary with alternatives[37], this paper chooses the mixed logit model as the explanatory variables can vary with alternatives.
According to the random utility theory and Lancaster's consumption demand theory, it is known that when consuming, consumers pay attention to the utility brought by product attributes rather than the products themselves[38]. When purchasing products, consumers will choose the product that brings them the maximum utility value. The total utility value Uijn for consumers is composed of fixed utility Vijn and unobservable random utilityεijn. Assuming consumer i chooses alternative j in scenario n, the following formula can be obtained:
The observable part of the utility can be decomposed into the linear summation of utilities brought by each attribute, including carbon label, hen farming method, hen feeding method, organic certification, DHA-enhanced eggs, and price. The formula is as follows:
where XKjn is consumer i's k-th choice out of the choice set j in scenario n, and βK is the utility component vector of that choice.
Assuming the probability density function of β is f(β|θ), the probability of consumer i choosing egg j in scenario n can be expressed as:
Furthermore, by comparing the coefficients of different egg attributes with the price coefficient, the willingness to pay of consumers for that attribute can be obtained[39]:
Data source and sample
The data for this study was collected online. Considering the efficiency of questionnaire collection and the difficulty of distributing choice experiment questionnaires, the questionnaire for this study was distributed utilizing the WJX platform. WJX is a powerful online data collection software which can randomly distribute the six versions of questionnaires to respondents, ensuring the randomness of choice experiments. Meanwhile, we randomly distributed questionnaires to cities across China, meeting the needs of large sample sizes in the eastern, central and western cities. A total of 1,260 questionnaires were collected in this online survey. After removing questionnaire samples with incomplete responses, excessively long or short response times, and those with a high number of repeated selections of the same option, a total of 1, 049 valid samples were obtained, resulting in an effective questionnaire rate of 83.25%. For the geographical divisions of eastern, central, and western cities in China, the standard of economic development level was adopted, following the division method of Li and Peng[40].
The sample size is determined with reference to formula (6)[41]:
where N is the minimum sample requirement, t is the number of choice sets, c is the maximum number of attribute levels, and a is the number of options. Thus, the minimum sample size required for this study is N > 500 × 4 ÷ 6 ÷ 3 = 111, which means that the minimum number of samples required for the three regions of East, Central and West is 111.
RESULTS AND DISCUSSION
Characteristics analysis of the sample
Among the consumer groups in the eastern, central, and western regions, the proportions of females were 65.2%, 63.81%, and 75.40%, respectively, which were largely higher than the proportions of males. This is consistent with the basic fact that most egg purchasers in China are female. In terms of age, most consumers were between 18-28 years old, followed by the middle-aged group of 40-50 years old, and the elderly population over 61 years old accounted for the least, which may be related to the online research method and the relatively low smartphone usage among the elderly. In terms of education level, consumer education levels were mainly concentrated in universities, indicating a relatively high level of education among consumer groups. In terms of income level, the overall income level in the eastern region was higher than that in central and western regions, which is consistent with the basic situation that the overall income level in eastern China is higher than in central and western regions. In terms of family structure, the proportions of families with minor children or elders over 60 years old in eastern, central, and western regions were 83.6%, 82.32%, and 72.19%, respectively, indicating that most families had the burden of raising children and caring for older adults. The results are shown in Table 4.
Consumer demographic characteristics
| Variables | Classification metrics | Eastern region | Central region | Western region | |||
| Sample size | Proportion | Sample size | Proportion | Sample size | Proportion | ||
| Gender | Male | 174 | 34.8 | 131 | 36.19 | 46 | 24.60 |
| Female | 326 | 65.2 | 231 | 63.81 | 141 | 75.40 | |
| Age | ≤ 18 | 8 | 1.6 | 6 | 1.66 | 6 | 3.21 |
| 18~28 | 266 | 53.2 | 210 | 58.01 | 169 | 90.37 | |
| 29~39 | 71 | 14.2 | 52 | 14.36 | 3 | 1.60 | |
| 40~50 | 104 | 20.8 | 70 | 19.34 | 5 | 2.67 | |
| 51~61 | 49 | 9.8 | 21 | 5.80 | 4 | 2.14 | |
| ≥ 61 | 2 | 0.4 | 3 | 0.83 | 0 | 0 | |
| Highest |
Elementary school | 1 | 0.2 | 4 | 1.10 |
|
|
| Middle school | 34 | 6.8 | 33 | 9.12 | 2 | 1.07 | |
| High school | 64 | 12.8 | 34 | 9.39 | 5 | 2.67 | |
| Undergraduate | 319 | 63.8 | 239 | 66.02 | 107 | 57.22 | |
| Postgraduate | 82 | 16.4 | 52 | 14.36 | 73 | 39.04 | |
| Monthly personal income (CNY) | < 3,000 | 244 | 48.8 | 214 | 59.12 | 149 | 79.68 |
| 3,000~5,000 | 117 | 23.4 | 78 | 21.55 | 19 | 10.16 | |
| 5,001~10,000 | 95 | 19 | 52 | 14.36 | 16 | 8.56 | |
| 10,001~20,000 | 38 | 7.6 | 15 | 4.14 | 1 | 0.53 | |
| 20,001~30,000 | 2 | 0.4 | 1 | 0.28 | 0 | 0 | |
| 30,001~40,000 | 1 | 0.2 | 0 | 0 | 0 | 0 | |
| 40,001~50,000 | 0 | 0 | 0 | 0 | 0 | 0 | |
| > 50,000 | 3 | 0.6 | 2 | 0.55 | 2 | 1.07 | |
| Whether there are minors or people over sixty years old | Yes | 418 | 83.6 | 298 | 82.32 | 135 | 72.19 |
| No | 82 | 16.4 | 64 | 17.68 | 52 | 27.81 | |
In the analysis of consumer awareness of carbon labels [Figure 2], the proportions of consumers in eastern, central, and western regions who understand the national “dual carbon” goal were 66.60%, 68.23%, and 71.12%, respectively. This shows that the consumer group surveyed pays relatively high attention to the national carbon reduction policy. In the process of analyzing consumer cognition of carbon labels, 49.40% of consumers in eastern regions said they did not understand relevant information about carbon labels, 45.86% of consumers in central regions did not understand the content related to carbon labels, and more than half of consumers in western regions did not understand relevant information about carbon labels. This shows that consumers' overall understanding of carbon labels is relatively low.
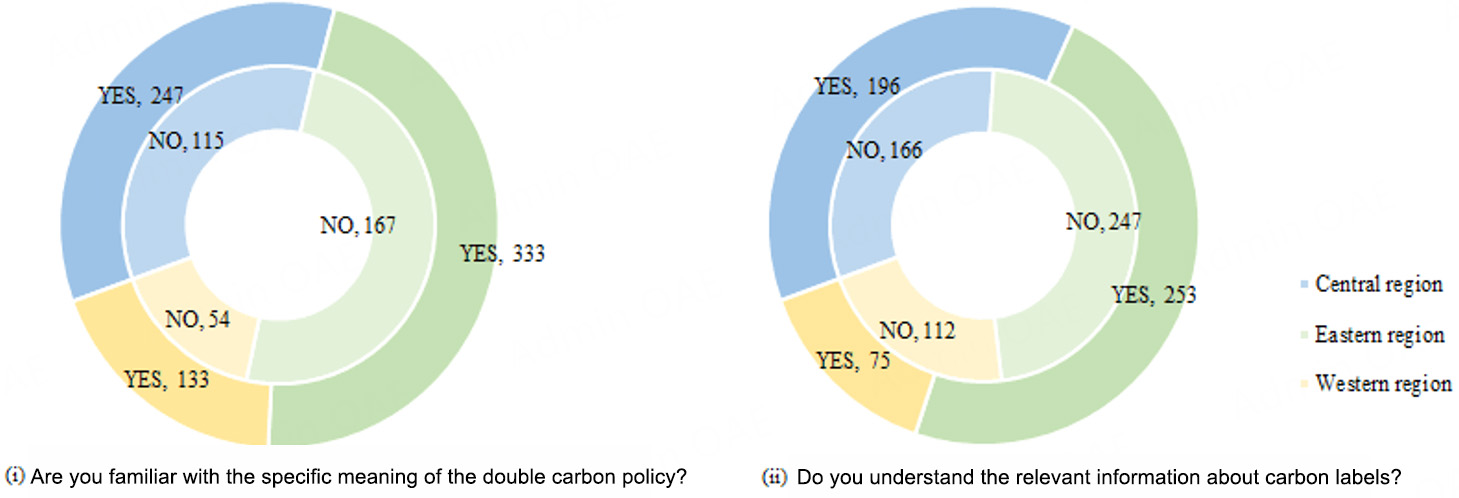
Figure 2. Policy focus and carbon label awareness.
Consumer preferences for carbon label designs
In addition to studying consumers' preferences for attributes of carbon-labeled eggs, this paper also investigated consumers' preferences for carbon-label styles. Carbon labels can be categorized into three types based on their expression forms: carbon identification, carbon rating, and carbon scoring. Among them, carbon identification labels only indicate that a product's carbon emissions are below a certain standard. Carbon rate labels compare a product's carbon footprint over its entire lifecycle with the industry average and identify the level it belongs to within the industry. Carbon score labels disclose the specific numerical value of a product's carbon footprint over its entire lifecycle[42]. According to the statistical results [Figure 3], carbon score style labels have the largest total proportion of 45% in the three consumer groups, indicating that consumers are more willing to accept intuitive and concrete digital information presentations and prompts. The proportion of carbon grade labels (29%) is slightly higher than carbon identifications (26%), with little difference between the two. Eastern, central, and western consumers have consistent order of preferences for the three types of carbon labels.

Figure 3. Consumer preferences for different carbon label designs.
Analysis of consumer motivations for purchasing carbon-labeled eggs based on binary logit model
An analysis of the feedback from surveyed consumers on their willingness to purchase carbon-labeled eggs found that 78.17% of the overall sample expressed a willingness to buy carbon-labeled eggs, indicating a relatively high overall level of willingness to pay. In eastern regions, 80.20% of consumers expressed a willingness to purchase carbon-labeled eggs, while in central regions, 76.52% of consumers expressed a willingness, and in western regions, 75.94% of consumers expressed a willingness. The overall willingness to pay was higher among eastern region consumers compared to central and western regions.
To further explore the different internal and external motives driving carbon-labeled egg purchases among consumers in different regions, this paper takes the four motives as independent variables and whether consumers are willing to purchase carbon-labeled eggs as the dependent binary variable. Further binary logistic regressions are conducted separately for eastern, central, and western regions [Table 5]. The regression results show that environmental motives and adventure motives have a significant impact on carbon-labeled egg purchases among eastern consumers, and adventure motives have a greater impact; trust motives have a significant impact on carbon-labeled egg purchases among central consumers; adventure motives have a significant impact on carbon-labeled eggs purchases among western consumers. The motives driving carbon-labeled egg purchases among central and western consumers are both exploratory, indicating that consumer groups tend to be conservative. Adventure motives are common for eastern and western consumers' carbon-labeled egg purchases, indicating that most Chinese consumers are still in an observational state regarding emerging carbon labeling of eggs.
Regression analysis of consumer motivation in East, Central, and West based on binary logit model
| Variables | Eastern region | Central region | Western region | ||||||
| Coefficient | Std. Err. | P-value | Coefficient | Std. Err. | P-value | Coefficient | Std. Err. | P-value | |
| Environment | 0.58*** | 0.21 | 0.006 | 0.23 | 0.24 | 0.346 | 0.39 | 0.35 | 0.265 |
| Trust | 0.12 | 0.23 | 0.599 | 0.66*** | 0.25 | 0.009 | 0.03 | 0.34 | 0.930 |
| Social | 0.14 | 0.23 | 0.531 | -0.20 | 0.28 | 0.474 | -0.01 | 0.37 | 0.969 |
| Risk | 0.79*** | 0.20 | 0.000 | 0.06 | 0.21 | 0.787 | 0.75*** | 0.25 | 0.003 |
| _cons | -4.53*** | 0.81 | 0.000 | -1.78** | 0.81 | 0.029 | -2.86** | 1.27 | 0.024 |
| Observations | 500 | 362 | 187 | ||||||
| Log-likelihood | -211.04478 | -185.88 | -93.847988 | ||||||
| LR chi2(4) | 75.53 | 22.83 | 18.68 | ||||||
| Pseudo R2 | 0.1518 | 0.0579 | 0.0905 | ||||||
| Prob > chi2 | 0.0000 | 0.0001 | 0.0009 | ||||||
Consumers' attribute preferences for carbon-labeled eggs and WTP
This paper uses the mixlogit command in Stata/MP 17.0 to obtain results through 10,000 Halton samples. The results are shown in Table 6. From the main effects, the price is significantly negative at the 1% level for consumers in the three regions, indicating that the higher the cost of carbon-labeled egg products, the lower the consumers' willingness to pay, which is consistent with the basic law of demand. Regarding preferences for labeling attributes, the low-carbon label is significantly positive at the 1% level for consumer groups in eastern, central, and western regions, and the standard deviation coefficients are also significantly positive at the 1% level. For the medium-carbon label, it is significantly positive at the 5% and 10% levels only for consumer groups in eastern and central regions. It has no significant impact on the western consumer group, indicating that compared with the high-carbon label, eastern, central, and western consumers all have a significant preference for the low-carbon label and heterogeneous preferences. Compared with the high-carbon label, eastern and central consumers have a significant preference for the medium-carbon label. In contrast, western consumers have no significant preference for the medium-carbon label. For other labels, free-range labels, natural feeding labels, and organic certification labels are all significantly positive in consumer groups in eastern, central, and western regions, indicating that posting the above three labels can bring consumers more utility than not posting the above labels. The DHA-enriched egg label is significantly positive for consumer groups in eastern and central regions but has no significant attractiveness for the western consumer group.
Preferences for carbon-labeled egg attributes among consumers in East, Central, and West
| Variables | Eastern region | Central region | Western region | ||||||
| Mean | Std. Err. | P-value | Mean | Std. Err. | P-value | Mean | Std. Err. | P-value | |
| Main effect | |||||||||
| PRICE | -0.344*** | 0.020 | 0.000 | -0.320*** | 0.024 | 0.000 | -0.376*** | 0.033 | 0.000 |
| LOW | 0.314*** | 0.039 | 0.000 | 0.313*** | 0.052 | 0.000 | 0.404*** | 0.071 | 0.000 |
| MED | 0.085** | 0.035 | 0.016 | 0.078* | 0.043 | 0.065 | 0.069 | 0.057 | 0.223 |
| FREE | 0.263*** | 0.037 | 0.000 | 0.228*** | 0.046 | 0.000 | 0.127** | 0.056 | 0.023 |
| NATU | 0.185*** | 0.035 | 0.000 | 0.111** | 0.043 | 0.010 | 0.227*** | 0.051 | 0.000 |
| ORG | 0.157*** | 0.029 | 0.000 | 0.158*** | 0.036 | 0.000 | 0.099** | 0.045 | 0.027 |
| DHA | 0.090*** | 0.028 | 0.001 | 0.071** | 0.033 | 0.034 | 0.047 | 0.045 | 0.299 |
| Interaction effect | |||||||||
| LOW*FREE | 0.198*** | 0.045 | 0.000 | 0.222*** | 0.055 | 0.000 | 0.207*** | 0.072 | 0.004 |
| MED*FREE | -0.015 | 0.047 | 0.753 | -0.045 | 0.056 | 0.420 | 0.040 | 0.077 | 0.604 |
| LOW*NATU | -0.066 | 0.046 | 0.149 | -0.085 | 0.056 | 0.126 | -0.035 | 0.076 | 0.646 |
| MED*NATU | -0.068 | 0.050 | 0.179 | 0.010 | 0.061 | 0.868 | -0.016 | 0.080 | 0.840 |
| LOW*ORG | -0.164*** | 0.051 | 0.001 | -0.047 | 0.062 | 0.445 | -0.109 | 0.082 | 0.185 |
| MED*ORG | 0.104** | 0.044 | 0.017 | 0.194*** | 0.053 | 0.000 | -0.004 | 0.071 | 0.959 |
| LOW*DHA | 0.202*** | 0.048 | 0.000 | 0.205*** | 0.058 | 0.000 | 0.096 | 0.077 | 0.210 |
| MED*DHA | -0.163*** | 0.041 | 0.000 | -0.151*** | 0.050 | 0.003 | -0.058 | 0.067 | 0.384 |
| S.D | |||||||||
| LOW | 0.476*** | 0.051 | 0.000 | 0.625*** | 0.062 | 0.000 | 0.643*** | 0.084 | 0.000 |
| MED | 0.000 | 0.078 | 0.999 | 0.000 | 0.101 | 0.999 | 0.001 | 0.138 | 0.994 |
| FREE | 0.529*** | 0.043 | 0.000 | 0.594*** | 0.053 | 0.000 | 0.474*** | 0.070 | 0.000 |
| NATU | 0.517*** | 0.042 | 0.000 | 0.565*** | 0.051 | 0.000 | 0.371*** | 0.068 | 0.000 |
| ORG | 0.199*** | 0.064 | 0.002 | 0.213*** | 0.075 | 0.004 | 0.000 | 0.288 | 1.000 |
| DHA | 0.001 | 0.064 | 0.985 | -0.002 | 0.116 | 0.987 | 0.072 | 0.263 | 0.783 |
| Sample Size | 500 | 362 | 187 | ||||||
| Observations | 9,000 | 6,516 | 3,366 | ||||||
| Log-likelihood | -2811.0146 | -2,048.9931 | -1,039.3626 | ||||||
| LR chi2(6) | 258.46 | 258.17 | 79.08 | ||||||
| Prob > chi2 | 0.0000 | 0.0000 | 0.0000 | ||||||
Regarding the main effect preference rankings within different consumer groups, the ranking for eastern consumers is: price > low-carbon label > free-range label > natural feeding label > organic label > DHA-enriched egg label > medium-carbon label. For central consumers, the ranking is: price > low-carbon label > free-range label > organic label > natural feeding label > medium-carbon label > DHA-enriched egg label. In the western consumer group, the ranking is: low-carbon label > price >natural feeding label > free-range label > organic label > medium-carbon label > DHA-enriched egg label. The rankings show that price is the primary and important consideration factor for the three consumer groups. The low-carbon label has a high ranking in the three consumer groups, indicating that compared to other egg attribute labels, the low-carbon label has more important meaning and value to consumers. However, the medium-carbon label ranks lower in the preferences of eastern, central, and western consumer groups, suggesting that consumers will only have a significant willingness to pay when their carbon footprint is reduced to a certain extent, which is consistent with the research results of Rahmani, Kallas[43]. The possible reason is that the consumption motives of the three consumer groups found earlier are mainly exploratory adventure motives and trust motives, and a larger reduction of carbon emissions is needed to gain consumers' recognition and trust. In addition, the free-range label is preferred over the organic certification label in the three consumer groups, which agrees with the research conclusions of Żakowska-Biemans and Tekień[44], further validating the rationality and reliability of the research results.
Further exploring the bidirectional interaction relationship between different label attributes and low-carbon and medium-carbon labels by setting the interaction items as fixed variables can help converge the model[45]. In terms of interaction effects, the interaction items between low-carbon labels and free-range labels are significantly positive at the 1% level in eastern, central, and western consumer groups, indicating that low-carbon labels and free-range labels are complementary to each other. This positive complementary effect may be due to the synergy between the “environmental effect” of the low-carbon label and the “animal welfare” of the free-range label, whereby the low-carbon behavior brings consumers the satisfaction of active social responsibility, while the guarantee of animal welfare makes the quality of the eggs healthier. Low-carbon behavior brings consumers the satisfaction of active social responsibility, while the guarantee of animal welfare makes the quality of eggs healthier, and the double effect further strengthens consumers' trust in the company or the government's certification. The interaction item between the low-carbon label and the organic certification label in the eastern consumer group is significantly negative at the 1% level, indicating substitutability between the low-carbon label and organic certification label in the eastern consumer group, possibly because simultaneous posting of organic certification label and low-carbon label may incur higher shopping costs in consumers' cognition. Some eastern consumers may view low carbon and organic as the same dimension, and the overlap in environmental attributes makes the marginal utility of both when present together lower than the sum of the marginal utility of each when present separately. The interaction item between the medium-carbon label and the organic certification label is significantly positive in eastern and central consumer groups, indicating complementarity between the medium-carbon label and the organic certification label. This is likely to be the result of the fact that the combination of a medium-carbon label and an organic label already meets the environmental and health needs of consumers, and that the combination does not impose an undue value-perception burden compared to the combination of a low-carbon label and an organic certification. In eastern and central consumer groups, the interaction items between medium-carbon labels and DHA-enriched egg labels are significantly negative at the 1% level, while the interaction items between low-carbon labels and DHA-enriched egg labels are significantly positive at the 1% level. This shows that simultaneous posting of DHA-enriched egg labels and medium-carbon labels may not meet consumers' utility needs in eastern and central consumer groups, resulting in perceived low cost-effectiveness, while simultaneous posting with low-carbon labels can better meet consumers' demands and bring extra premiums. In general, consumers in eastern and central regions pay more attention to the combined effects of carbon labels and other attribute labels, while consumers in western regions have weaker preferences for combined effects.
Taken together, consumer groups prefer labels with more reduced carbon footprints, yet in some cases, the combination of low-carbon label and other labels may create an information overload for consumers that exceeds their mental budgets or expectations, thus reducing their willingness to pay.
Consumers across all three regions exhibited varying degrees of willingness to pay a premium for carbon-labeled eggs, which aligns with the findings of Xu et al.[46]. This study calculates the marginal willingness to pay for consumers of different label main effects and different combined label interaction effects based on regression results and formulas. The 95% confidence intervals are determined by the parameter self-expansion technique of Krinsky and Robb[47]. The results are shown in Table 7.
The WTP for different attributes of eggs among eastern, central, and western consumers
| Variables | Eastern region | Central region | Western region | |||
| WTP | 95% confidence interval | WTP | 95% confidence interval | WTP | 95% confidence interval | |
| LOW | 0.91** | [0.68, 1.16] | 0.98** | [0.64, 1.34] | 1.07** | [0.68, 1.50] |
| MED | 0.25** | [0.05, 0.45] | 0.25 | [-0.01, 0.51] | 0.18 | [-0.10, 0.49] |
| FREE | 0.77** | [0.55, 0.98] | 0.71** | [0.43, 1.01] | 0.34** | [0.05, 0.63] |
| NATU | 0.54** | [0.34, 0.77] | 0.35** | [0.09, 0.65] | 0.60** | [0.34, 0.93] |
| ORG | 0.46** | [0.30, 0.64] | 0.49** | [0.30, 0.73] | 0.26** | [0.04, 0.50] |
| DHA | 0.26** | [0.11, 0.43] | 0.22** | [0.02, 0.44] | 0.13 | [-0.11, 0.37] |
| LOW*FREE | 0.58** | [0.31, 0.85] | 0.70** | [0.34, 1.08] | 0.55** | [0.16, 0.97] |
| MED*FREE | -0.04 | [-0.32, 0.20] | -0.14 | [-0.50, 0.18] | 0.11 | [-0.31, 0.49] |
| LOW*NATU | -0.19 | [-0.45, 0.05] | -0.27 | [-0.59, 0.05] | -0.09 | [-0.47, 0.27] |
| MED*NATU | -0.20 | [-0.46, 0.07] | 0.03 | [-0.31, 0.41] | -0.04 | [-0.43, 0.38] |
| LOW*ORG | -0.48** | [-0.78, -0.19] | -0.15 | [-0.53, -0.24] | -0.29 | [-0.73, 0.15] |
| MED*ORG | 0.30** | [0.06, 0.55] | 0.61** | [0.29, 0.93] | -0.01 | [-0.37, 0.35] |
| LOW*DHA | 0.59** | [0.32, 0.87] | 0.64** | [0.29, 1.02] | 0.26 | [-0.15, 0.67] |
| MED*DHA | -0.48** | [-0.70, -0.26] | -0.47** | [-0.76, -0.18] | -0.16 | [-0.50, 0.18] |
To demonstrate the main effect preferences and interaction effect preferences more intuitively, Figure 4 is also presented in this paper. The study finds that consumers' significant carbon label payment premium ranges from ¥0.25 to ¥1.07 per egg, and the low-carbon label payment premium is significantly higher than the medium-carbon label. In addition, consumers in the three regions generally show consistent preferences for different label combinations. Among them, consumers in central regions are willing to pay a ¥0.70 premium for a combination of low-carbon and free-range labels. However, it should be noted that according to the perspective of Xiong et al., the estimated premium may be inflated due to the presence of high-SDB (Social Desirability Bias) groups that conform to social expectations[48].

Figure 4. Consumers' preferences for different labels.
The impact of consumer demographic characteristics on carbon-labeled eggs
Table 8 shows the impact of consumer demographic characteristics on willingness to pay for carbon-labeled eggs. In the eastern consumer group, the interaction item between medium-carbon label and age is significantly negative at the 5% level, possibly indicating that consumers with older ages are less willing to pay premiums for carbon-labeled eggs. It may be related to more conservative and thrifty thinking with increasing age as well as weaker acceptance of new things. Older people may also be inclined to believe that carbon-labeled eggs being more expensive would lead to unnecessary losses. In the central consumer group, the interaction between low-carbon label and family structure is significantly negative at the 1% level. If consumers have child or elderly care burdens at home, it will reduce their willingness to pay for carbon-labeled eggs. Larger family burdens would cause consumers to choose between “environmental protection” and “saving money” and ultimately choose ordinary eggs to buy at lower costs to alleviate family burdens. In addition, income level, gender, and education level have no significant impact on consumers' willingness to purchase carbon-labeled eggs in eastern, central, and western consumer groups.
The impact of individual characteristics on consumers' purchase of carbon-labeled eggs
| Variables | Eastern region | Central region | Western region | ||||||
| Mean | Std. Err | P-value | Mean | Std. Err | P-value | Mean | Std. Err | P-value | |
| Main effect | |||||||||
| PRICE | -0.335*** | 0.019 | 0.000 | -0.311*** | 0.023 | 0.000 | -0.393*** | 0.032 | 0.000 |
| LOW | -0.028 | 0.316 | 0.930 | 0.772* | 0.403 | 0.055 | 0.611 | 0.686 | 0.373 |
| MED | 0.204 | 0.278 | 0.462 | 0.010 | 0.319 | 0.974 | -0.067 | 0.548 | 0.902 |
| FREE | 0.255*** | 0.036 | 0.000 | 0.223*** | 0.045 | 0.000 | 0.126** | 0.055 | 0.022 |
| NATU | 0.175*** | 0.034 | 0.000 | 0.116*** | 0.042 | 0.006 | 0.209*** | 0.048 | 0.000 |
| ORG | 0.141*** | 0.028 | 0.000 | 0.135*** | 0.034 | 0.000 | 0.101** | 0.043 | 0.019 |
| DHA | 0.064** | 0.026 | 0.014 | 0.032 | 0.031 | 0.303 | 0.037 | 0.043 | 0.392 |
| Interaction effect | |||||||||
| LOW*INCOME | 0.043 | 0.037 | 0.241 | 0.001 | 0.053 | 0.986 | -0.106 | 0.081 | 0.188 |
| MED*INCOME | 0.036 | 0.032 | 0.257 | -0.014 | 0.041 | 0.731 | 0.069 | 0.063 | 0.273 |
| LOW*GEN | 0.048 | 0.083 | 0.561 | 0.158 | 0.110 | 0.151 | 0.067 | 0.166 | 0.686 |
| MED*GEN | 0.005 | 0.073 | 0.943 | 0.074 | 0.087 | 0.391 | 0.026 | 0.129 | 0.840 |
| LOW*AGE | -0.034 | 0.042 | 0.416 | -0.066 | 0.058 | 0.259 | 0.110 | 0.130 | 0.399 |
| MED*AGE | -0.085** | 0.037 | 0.023 | 0.038 | 0.046 | 0.408 | -0.085 | 0.105 | 0.420 |
| LOW*EDU | 0.052 | 0.057 | 0.367 | -0.014 | 0.072 | 0.847 | -0.076 | 0.126 | 0.545 |
| MED*EDU | 0.022 | 0.051 | 0.670 | -0.018 | 0.057 | 0.747 | 0.077 | 0.099 | 0.435 |
| LOW*STRUCTURE | 0.156 | 0.104 | 0.134 | -0.392*** | 0.139 | 0.005 | -0.022 | 0.159 | 0.892 |
| MED*STRUCTURE | -0.023 | 0.090 | 0.799 | 0.031 | 0.112 | 0.784 | -0.168 | 0.121 | 0.167 |
| S.D. | |||||||||
| LOW | 0.445*** | 0.051 | 0.000 | 0.609*** | 0.061 | 0.000 | 0.638*** | 0.083 | 0.000 |
| MED | 0.000 | 0.070 | 0.995 | -0.001 | 0.095 | 0.995 | 0.001 | 0.115 | 0.995 |
| FREE | 0.531*** | 0.043 | 0.000 | 0.597*** | 0.053 | 0.000 | 0.484*** | 0.070 | 0.000 |
| NATU | 0.515*** | 0.041 | 0.000 | 0.562*** | 0.051 | 0.000 | 0.354*** | 0.069 | 0.000 |
| ORG | 0.208*** | 0.060 | 0.001 | 0.217*** | 0.072 | 0.003 | 0.001 | 0.342 | 0.997 |
| DHA | 0.001 | 0.062 | 0.990 | -0.001 | 0.100 | 0.989 | 0.103 | 0.184 | 0.575 |
| Sample size | 500 | 362 | 187 | ||||||
| Observations | 9000 | 6516 | 3366 | ||||||
| Log-likelihood | -2831.5457 | -2063.3022 | -1043.9422 | ||||||
| LR chi2(6) | 257.34 | 256.18 | 79.34 | ||||||
| Prob > chi2 | 0.0000 | 0.0000 | 0.0000 | ||||||
ROBUSTNESS CHECK
This study examines the robustness of key findings through model substitution and sample reduction approaches. Although the conditional logit model assumes preference homogeneity with fixed individual parameters (thus ignoring consumer heterogeneity in attribute preferences), our comparison with the mixed logit model reveals [Table 9]: apart from coefficient magnitude differences due to heterogeneity considerations, both models show consistent significance and direction for core explanatory variables (price, low-carbon label attribute, and medium-carbon label attribute). This indicates that consumers' price sensitivity and positive preference for low-carbon attributes are universal characteristics. The findings remain insensitive to model selection, further supporting the generalizability and robustness of our research conclusions.
Robustness test based on the conditional logit model
| Variables | Eastern region | Central region | Western region | ||||||
| Mean | Std. Err. | P-value | Mean | Std. Err. | P-value | Mean | Std. Err. | P-value | |
| Main effect | |||||||||
| PRICE | -0.274*** | 0.015 | 0.000 | -0.246*** | 0.018 | 0.000 | -0.310*** | 0.026 | 0.000 |
| LOW | 0.247*** | 0.027 | 0.000 | 0.245*** | 0.031 | 0.000 | 0.341*** | 0.044 | 0.000 |
| MED | 0.085* | 0.028 | 0.079 | 0.018* | 0.032 | 0.585 | -0.007 | 0.046 | 0.884 |
| FREE | 0.263*** | 0.022 | 0.000 | 0.143*** | 0.025 | 0.000 | 0.093** | 0.036 | 0.010 |
| NATU | 0.185*** | 0.021 | 0.000 | 0.087*** | 0.024 | 0.000 | 0.171*** | 0.035 | 0.000 |
| ORG | 0.157*** | 0.023 | 0.000 | 0.092*** | 0.026 | 0.000 | 0.066* | 0.037 | 0.073 |
| DHA | 0.090*** | 0.023 | 0.002 | 0.061** | 0.027 | 0.023 | 0.048 | 0.039 | 0.213 |
| Interaction effect | |||||||||
| LOW*FREE | 0.157*** | 0.040 | 0.000 | 0.166*** | 0.044 | 0.000 | 0.164*** | 0.061 | 0.007 |
| MED*FREE | 0.005 | 0.040 | 0.895 | 0.004 | 0.046 | 0.926 | 0.072 | 0.066 | 0.271 |
| LOW*NATU | -0.072* | 0.040 | 0.069 | -0.104** | 0.046 | 0.024 | -0.060 | 0.066 | 0.369 |
| MED*NATU | -0.075* | 0.043 | 0.084 | -0.002 | 0.051 | 0.967 | -0.001 | 0.070 | 0.992 |
| LOW*ORG | -0.113*** | 0.041 | 0.005 | -0.013 | 0.047 | 0.788 | -0.085 | 0.068 | 0.211 |
| MED*ORG | 0.076** | 0.035 | 0.031 | 0.149*** | 0.041 | 0.000 | 0.004 | 0.059 | 0.945 |
| LOW*DHA | 0.164*** | 0.038 | 0.000 | 0.149*** | 0.044 | 0.001 | 0.088 | 0.063 | 0.163 |
| MED*DHA | -0.133*** | 0.035 | 0.000 | -0.117*** | 0.041 | 0.004 | -0.049 | 0.058 | 0.404 |
| Sample Size | 500 | 362 | 187 | ||||||
| Observations | 9,000 | 6,516 | 3,366 | ||||||
| Log-likelihood | -2,940.2438 | -2,178.0805 | -1,078.9008 | ||||||
| LR chi2(15) | 711.19 | 416.21 | 307.48 | ||||||
| Prob > chi2 | 0.0000 | 0.0000 | 0.0000 | ||||||
To further verify the robustness of consumer preferences for core explanatory variables across different regional groups, this study employs Stata's sample command to conduct non-replacement random resampling to obtain the minimum required sample size (111 observations) for each of the three regions and re-estimates the models. The results in Table 10 demonstrate that although the substantially reduced sample size leads to diminished randomness and representativeness, resulting in changes to the significance levels and signs of some coefficients, the core explanatory variables - price coefficient and low-carbon attribute preference - exhibit nearly unchanged coefficient magnitudes, significance levels, and directions across all three consumer groups. Specifically, consumers' price sensitivity remains negatively significant, their preference for low-carbon labels remains positively significant, and their preference for medium-carbon labels remains significant only in the eastern region, further confirming the robustness of our key findings regarding price sensitivity and low-carbon preferences among different regional consumer groups.
Robustness test of core explanatory variables based on minimum sample size requirements
| Variables | Eastern region | Central region | Western region | ||||||
| Mean | Std. Err. | P-value | Mean | Std. Err. | P-value | Mean | Std. Err. | P-value | |
| Main effect | |||||||||
| PRICE | -0.319*** | 0.039 | 0.000 | -0.382*** | 0.043 | 0.000 | -0.415*** | 0.045 | 0.000 |
| LOW | 0.250*** | 0.078 | 0.001 | 0.370*** | 0.094 | 0.000 | 0.382*** | 0.097 | 0.000 |
| MED | 0.132* | 0.071 | 0.063 | 0.061 | 0.076 | 0.421 | 0.072 | 0.074 | 0.332 |
| FREE | 0.213*** | 0.070 | 0.003 | 0.207*** | 0.073 | 0.005 | 0.023 | 0.074 | 0.757 |
| NATU | 0.152** | 0.064 | 0.017 | 0.088 | 0.072 | 0.224 | 0.237*** | 0.064 | 0.000 |
| ORG | 0.112** | 0.056 | 0.046 | 0.147** | 0.060 | 0.014 | 0.079 | 0.062 | 0.205 |
| DHA | 0.140** | 0.057 | 0.013 | 0.069 | 0.060 | 0.253 | 0.125** | 0.064 | 0.049 |
| Interaction effect | |||||||||
| LOW*FREE | 0.065 | 0.089 | 0.461 | 0.132 | 0.099 | 0.181 | 0.142 | 0.097 | 0.144 |
| MED*FREE | 0.004 | 0.095 | 0.967 | 0.103 | 0.102 | 0.310 | 0.063 | 0.101 | 0.531 |
| LOW*NATU | -0.149 | 0.092 | 0.104 | -0.163 | 0.103 | 0.114 | -0.074 | 0.103 | 0.468 |
| MED*NATU | 0.012 | 0.101 | 0.905 | 0.108 | 0.107 | 0.315 | 0.045 | 0.108 | 0.680 |
| LOW*ORG | -0.127 | 0.101 | 0.211 | -0.045 | 0.110 | 0.679 | -0.049 | 0.109 | 0.653 |
| MED*ORG | 0.091 | 0.089 | 0.307 | 0.220** | 0.095 | 0.020 | -0.041 | 0.095 | 0.664 |
| LOW*DHA | 0.077 | 0.097 | 0.427 | 0.235** | 0.102 | 0.021 | 0.060 | 0.101 | 0.548 |
| MED*DHA | -0.123 | 0.082 | 0.132 | -0.338*** | 0.092 | 0.000 | -0.019 | 0.086 | 0.827 |
| S.D. | |||||||||
| LOW | 0.434*** | 0.103 | 0.000 | 0.658*** | 0.111 | 0.000 | 0.682*** | 0.115 | 0.000 |
| MED | 0.000 | 0.122 | 0.999 | -0.001 | 0.162 | 0.996 | 0.000 | 0.170 | 1.000 |
| FREE | 0.460*** | 0.086 | 0.000 | 0.468*** | 0.090 | 0.000 | 0.481*** | 0.092 | 0.000 |
| NATU | 0.377*** | 0.083 | 0.000 | 0.494*** | 0.088 | 0.000 | 0.315*** | 0.095 | 0.001 |
| ORG | 0.002 | 0.172 | 0.992 | 0.003 | 0.246 | 0.990 | -0.182 | 0.142 | 0.202 |
| DHA | 0.001 | 0.154 | 0.996 | -0.003 | 0.201 | 0.988 | 0.187 | 0.148 | 0.205 |
| Sample Size | 111 | 111 | 111 | ||||||
| Observations | 1,998 | 1,998 | 1,998 | ||||||
| Log-likelihood | -639.58636 | -608.28312 | -613.85114 | ||||||
| LR chi2(6) | 36.51 | 60.57 | 46.16 | ||||||
| Prob > chi2 | 0.0000 | 0.0000 | 0.0000 | ||||||
CONCLUSIONS AND POLICY IMPLICATIONS
This paper explores the motivations of consumers in China's eastern, central, and western regions to purchase carbon-labeled eggs through the Likert scale. The choice experiment method is used to examine consumers' preferences and willingness to pay for carbon-labeled eggs as well as the heterogeneity of their preferences, which provides a reference for the promotion of carbon-labeled eggs and other carbon-labeled agricultural products. The results show that consumers are still unfamiliar with and curious about carbon-labeled eggs and carbon-labeled products in most areas of China. The motivation for environmental protection in purchasing carbon-labeled eggs is insufficient. Compared with other regions, consumers in eastern China have better environmental awareness and more willingness to try new things. Price is still the main concern for consumer groups, but consumers have a higher willingness to pay a premium for low-carbon labels. However, for carbon labels with slightly lower carbon footprint reduction, there is no significant willingness to pay a premium in western and central China, while consumers in eastern China have a significant willingness to pay a premium for both low-carbon labels and medium-carbon labels. The combination of low-carbon labels and free-range labels is the most popular among consumer groups. Within specific groups, there may be substitutable effects between some labels and carbon labels, such as the combination of low-carbon labels and organic labels favored by consumer groups in eastern China. Based on the above, the following policy implications are drawn.
Firstly, the design of carbon labels should be emphasized. Information asymmetry is an important barrier between consumers and manufacturers. Carbon-labeled eggs, as a new type of credence good, need government certification to enhance consumers' recognition. Consumers prefer carbon label styles that provide more detailed and specific carbon emission information, which can bring them a greater sense of security and trust. Therefore, egg products should display the carbon footprint in detail on the carbon label, which is conducive to consumers' intuitive comparison and selection. However, we cannot ignore consumers' limited capacity to process information. Excessive information will impose a cognitive burden on consumers. Therefore, combining intuitive forms such as traffic light labels can achieve better results[30]. In addition, carbon footprint traceability could be one of the effective ways to build a trust system[49]. Setting a QR code for traceability on the carbon label so that consumers can scan the code to query the carbon emission information of the entire egg production process can effectively eliminate consumers' concerns.
Secondly, to effectively promote carbon-labeled agricultural products in China, awareness, marketing strategies, and sales channels must be optimized based on regional characteristics. Specifically, consumer understanding of carbon labeling is relatively low across eastern, central, and western China. While publicity efforts and environmental education need strengthening nationwide, greater focus is warranted in western areas due to lower environmental protection motivation. Some specific application scenarios may include: (1) Launching targeted promotional campaigns on short video platforms featuring carbon-labeled products, collaborating with influential bloggers to disseminate scientific knowledge, and organizing regular livestream sessions with environmental experts to address consumer inquiries. This approach will help enhance public awareness and trust in carbon labeling systems; (2) Retail stores can install interactive carbon footprint displays where scanning product labels triggers dynamic visualization of lifecycle emission reduction data (e.g., “Per-egg carbon reduction ≈ planting X trees”), effectively translating environmental benefits into tangible consumption achievements; (3) It is suggested to implement a household point-based program that incentivizes participation through monthly evaluations of uploaded purchase receipts, redeemable points for eco-friendly merchandise, and supplementary social referral rewards that grant additional points for successful recruitment of household consumers, thereby establishing social reinforcement mechanisms for low-carbon consumption; and (4) Initiating a “Low-Carbon Recipe Challenge” campaign to encourage creative culinary innovations while promoting increased utilization of carbon-labeled eggs, effectively merging environmental consciousness with gastronomic experimentation.
Furthermore, a tailored regional approach should guide the marketing and positioning of carbon-labeled products. The eastern region is still the focus of the carbon-labeled egg market launch. Consumers in eastern regions show a clearer willingness to pay for low-carbon and medium-carbon labeled eggs. Therefore, launching carbon-labeled egg products in the eastern region first to open up the market is a feasible strategy. Furthermore, both offline supermarket promotion as the primary channel and emerging online methods must be leveraged to disseminate information and facilitate sales of carbon-labeled eggs. Given traditional consumers' greater familiarity with offline shopping, supermarkets should initially take precedence. However, the younger demographics reached through online avenues are more receptive to novel concepts such as carbon labeling. Moreover, the growth of e-commerce and livestreaming has created new promotional opportunities via these digital sales routes. Therefore, online sales should also be emphasized as an important approach.
Finally, in developing marketing strategies for carbon-labeled eggs, consideration must be given to both label combinations and targeted segmentation approaches. Specifically, promoting free-range, low-carbon, and medium-carbon labeled eggs together in eastern, central, and western China presents opportunities. In eastern and central regions, pairing medium-carbon labels with organic labels or low-carbon labels with DHA nutritional labels warrants exploration. However, the substitutability of some labels should be noted, as one type may dilute interest in another[50]. Internal segmentation within regions is important to recognize differing consumer preferences. For example, eastern preferences relate more to age, while central regions consider family structures more. Thus, tailored plans targeting younger eastern consumers and lighter-burden central families first can most effectively introduce carbon-labeled eggs. Implementing differentiated promotional strategies based on further dividing eastern, central, and western areas holds promise.
However, this study still has limitations that could be addressed in future research. First, the analysis did not account for consumers' purchasing habits, such as preferred shopping locations and purchase frequency, which may significantly influence their decisions to buy carbon-labeled eggs. Second, future studies could incorporate policy simulations to examine how potential government interventions - including subsidies for carbon-labeled products or tax incentives for low-carbon purchases - might affect consumer behavior. Finally, more sophisticated consumer segmentation could be achieved by applying advanced analytical methods like the latent class logit model, which would enable more nuanced identification of consumer subgroups based on their heterogeneous preferences. These improvements would provide deeper insights into the factors driving consumer choices regarding carbon-labeled food products.
DECLARATIONS
Authors’ contributions
Methodology, investigation, formal analysis, writing - original draft: Zhang, Z.
Methodology, investigation, writing - review & editing, Conceptualization: Xu, Y, Li, R.
Conceptualization, writing - review & editing, project administration, supervision, funding acquisition: Wang, Y, Chen, W.
Availability of data and materials
The data are available from the corresponding authors upon reasonable request.
Financial support and sponsorship
This work was supported by the National Natural Science Foundation of China (42401374, 72203171), Research and Development Platform for Common Technologies in Livestock and Poultry Breeding of Shaanxi Province “Livestock and Poultry Breeding Intelligent Service Platform” (2023GXJS-02-02), and the Humanities and Social Science Fund of the Ministry of Education of China (22YJC790099).
Conflicts of interest
All authors declared that there are no conflicts of interest.
Ethical approval and consent to participate
Not applicable.
Consent for publication
Not applicable.
Copyright
© The Author(s) 2025.
REFERENCES
1. Crippa, M.; Solazzo, E.; Guizzardi, D.; Monforti-Ferrario, F.; Tubiello, F. N.; Leip, A. Food systems are responsible for a third of global anthropogenic GHG emissions. Nat. Food. 2021, 2, 198-209.
2. Rojas-Downing, M. M.; Nejadhashemi, A. P.; Harrigan, T.; Woznicki, S. A. Climate change and livestock: impacts, adaptation, and mitigation. Clim. Risk. Manag. 2017, 16, 145-63.
3. Ghasempour, A.; Ahmadi, E. Assessment of environment impacts of egg production chain using life cycle assessment. J. Environ. Manag. 2016, 183, 980-7.
4. Gerber, P. J.; Steinfeld, H.; Henderson, B.; et al. . Tackling climate change through livestock: a global assessment of emissions and mitigation opportunities. Food and Agriculture Organization of the United Nations (FAO); 2013. Available from: https://www.fao.org/4/i3437e/i3437e00.htm [Last accessed on 25 Apr 2025].
5. Grassauer, F.; Arulnathan, V.; Pelletier, N. Towards a net-zero greenhouse gas emission egg industry: a review of relevant mitigation technologies and strategies, current emission reduction potential, and future research needs. Renew. Sustain. Energy. Rev. 2023, 181, 113322.
7. Liu, Y.; Tao, W. Recent China's egg market situation and its future prospect. Agric. Outlook. 2019, 15, 8-13.
8. Li, Q.; Long, R.; Chen, H. Empirical study of the willingness of consumers to purchase low-carbon products by considering carbon labels: a case study. J. Clean. Prod. 2017, 161, 1237-50.
9. Upham, P.; Dendler, L.; Bleda, M. Carbon labelling of grocery products: public perceptions and potential emissions reductions. J. Clean. Prod. 2011, 19, 348-55.
10. Elofsson, K.; Bengtsson, N.; Matsdotter, E.; Arntyr, J. The impact of climate information on milk demand: evidence from a field experiment. Food. Policy. 2016, 58, 14-23.
11. Hartikainen, H.; Roininen, T.; Katajajuuri, J. M.; Pulkkinen, H. Finnish consumer perceptions of carbon footprints and carbon labelling of food products. J. Clean. Prod. 2014, 73, 285-93.
12. Holenweger, G.; Stöckli, S.; Brügger, A. Carbon footprint labels involving traffic lights foster sustainable food choices. Food. Qual. Prefer. 2023, 106, 104813.
13. Liu, C.; Xiong, K.; Chen, X.; Huang, X. Consumer behavior patterns of carbon neutral label using the unified theory of acceptance and use of technology. Chin. J. Popul. Resour. Environ. 2023, 21, 137-44.
14. Zhao, R.; Geng, Y.; Liu, Y.; Tao, X.; Xue, B. Consumers’ perception, purchase intention, and willingness to pay for carbon-labeled products: a case study of Chengdu in China. J. Clean. Prod. 2018, 171, 1664-71.
15. Edenbrandt, A. K.; Asioli, D.; Nordström, J. Impact of different carbon labels on consumer inference. J. Clean. Prod. 2025, 494, 145020.
16. Xu, M.; Lin, B. Towards low-carbon economy by carbon label?: survey evidence from first-tier cities in China. Environ. Impact. Assess. Rev. 2022, 97, 106902.
17. Rondoni, A.; Grasso, S. Consumers behaviour towards carbon footprint labels on food: a review of the literature and discussion of industry implications. J. Clean. Prod. 2021, 301, 127031.
18. Broeckhoven, I.; Verbeke, W.; Tur-Cardona, J.; Speelman, S.; Hung, Y. Consumer valuation of carbon labeled protein-enriched burgers in European older adults. Food. Qual. Prefer. 2021, 89, 104114.
19. Canavari, M.; Coderoni, S. Consumer stated preferences for dairy products with carbon footprint labels in Italy. Agric. Econ. 2020, 8, 149.
20. Wong, E. Y. C.; Chan, F. F. Y.; So, S. Consumer perceptions on product carbon footprints and carbon labels of beverage merchandise in Hong Kong. J. Clean. Prod. 2020, 242, 118404.
21. Mostafa, M. M. Egyptian consumers' willingness to pay for carbon-labeled products: a contingent valuation analysis of socio-economic factors. J. Clean. Prod. 2016, 135, 821-8.
22. Zhao, R.; Yang, M.; Liu, J.; Yang, L.; Bao, Z.; Ren, X. University students’ purchase intention and willingness to pay for carbon-labeled food products: a purchase decision-making experiment. Int. J. Environ. Res. Public. Health. 2020, 17, 7026.
23. Loo EJ, Caputo V, Nayga RM, Verbeke W. Consumers’ valuation of sustainability labels on meat. Food. Policy. 2014, 49, 137-50.
24. Chen, Y. S.; Chang, C. H. Enhance green purchase intentions: the roles of green perceived value, green perceived risk, and green trust. Manag. Decis. 2012, 50, 502-20.
25. Shuai, C. M.; Ding, L. P.; Zhang, Y. K.; Guo, Q.; Shuai, J. How consumers are willing to pay for low-carbon products? – Results from a carbon-labeling scenario experiment in China. J. Clean. Prod. 2014, 83, 366-73.
26. Yao, J.; Guo, X.; Wang, L.; Jiang, H. An evolutionary game and system dynamics approach for the production and consumption of carbon-labeled products-based on a media monitoring perspective. J. Environ. Manag. 2024, 360, 121154.
27. Lizin, S.; Rousseau, S.; Kessels, R.; et al. The state of the art of discrete choice experiments in food research. Food. Qual. Prefer. 2022, 102, 104678.
28. Liu, R.; Gao, Z.; Nayga Jr, R. M.; Snell, H. A.; Ma, H. Consumers’ valuation for food traceability in China: does trust matter?. Food. Policy. 2019, 88, 101768.
29. Aoki, K.; Akai, K. A comparison between Spain and Japan with respect to the color, expected taste scale, and sustainability of strawberries: a choice experiment. Food. Qual. Prefer. 2023, 103, 104671.
30. Panzone, L. A.; Sniehotta, F. F.; Comber, R.; Lemke, F. The effect of traffic-light labels and time pressure on estimating kilocalories and carbon footprint of food. Appetite 2020, 155, 104794.
31. Chen, R.; Jiang, C.; Li, X.; et al. Research on Chinese consumers’ shell egg consumption preferences and the egg quality of functional eggs. Poult. Sci. 2023, 102, 103007.
32. Chiumiento, F.; Bellocci, M.; Ceci, R.; et al. A new method for determining PFASs by UHPLC-HRMS (Q-Orbitrap): application to PFAS analysis of organic and conventional eggs sold in Italy. Food. Chem. 2023, 401, 134135.
33. Garcia, J. S.; Anderson, K. E.; Guard, J. Y.; Gast, R. K.; Jones, D. R. Impact of paddock area stocking density of free-range laying hens on egg and environmental microbiology. J. Appl. Poult. Res. 2023, 32, 100338.
34. Kaewsutas, M.; Sarikaphuti, A.; Nararatwanchai, T.; Sittiprapaporn, P.; Patchanee, P. Electroencephalographic study of microalgae DHA omega-3 egg consumption on cognitive function. J. Funct. Foods. 2017, 29, 46-52.
35. Cao, Y.; Cranfield, J.; Chen, C.; Widowski, T. Heterogeneous informational and attitudinal impacts on consumer preferences for eggs from welfare enhanced cage systems. Food. Policy. 2021, 99, 101979.
36. Alkharusi, H. Categorical variables in regression analysis: a comparison of dummy and effect coding. Int. J. Educ. 2012, 4, 202.
37. Brownstone, D.; Train, K. Forecasting new product penetration with flexible substitution patterns. J. Econometrics. 1998, 89, 109-29.
39. Hanemann, W. M. Welfare evaluations in contingent valuation experiments with discrete responses. Am. J. Agric. Econ. 1984, 66, 332-41.
40. Li, J.; Peng, Y.; Ma, S. Inclusive finance and economic development in China: multidimensional connotation and empirical analysis. Econ. Res. J. 2020, 55, 37-52. Available from: https://kns.cnki.net/kcms2/article/abstract?v=RN_8baVbY4f4siLDVIccUAl34jmuqHfyaslvX-L45mKUBu32ov-Ul8YLw_hX76mMgGIvGgaHkn700c0zWRMVevEy44pOmSnVCa7YTbBxwW7qtOwmFt9-KPU1xLFJFofzv_z8uKtF4JSRaivCo6EQAC-gmcPa2drPV3xx_7dqmmzL-J_-_S6R_TLNIptsGyUuZC_Sbxi3YMsSSbjm_8PCYA==&uniplatform=NZKPT [Last accessed on 25 Apr 2025].
41. Zheng, Q.; Wen, X.; Xiu, X.; Yang, X.; Chen, Q. Can the part replace the whole? A choice experiment on organic and pesticide-free labels. Foods 2022, 11, 2564.
42. CCPIT. Introduction to product carbon labelling system 2021. Available from: https://www.ccpit.org/a/20211104/20211104vprx.html [Last accessed on 23 Apr 2025].
43. Rahmani, D.; Kallas, Z.; Pappa, M.; Gil, J. M. Are consumers’ egg preferences influenced by animal-welfare conditions and environmental impacts?. Sustainability 2019, 11, 6218.
44. Żakowska-Biemans, S.; Tekień, A. Free range, organic? Polish Consumers Preferences Regarding Information on Farming System and Nutritional Enhancement of Eggs: A Discrete Choice Based Experiment. Sustainability 2017, 9, 1999.
45. Zhu, Z.; Zhang, T.; Hu, W. The accumulation and substitution effects of multi-nation certified organic and protected eco-origin food labels in China. Ecol. Econ. 2023, 203, 107625.
46. Xu, Y.; Xian, B.; Ren, Y.; Wang, Y.; Lang, L.; Wang, B. Do carbon labels increase Chinese consumers’ willingness to pay for carbon-labeled agricultural products?. J. Clean. Prod. 2024, 434, 140299.
47. Krinsky, I.; Robb, A. L. On approximating the statistical properties of elasticities. Rev. Econ. Stat. 1986, 68, 715-9.
48. Xiong, H.; Hu, W.; Xu, M.; Zhan, J. Revisiting heterogenous social desirability bias in consumer willingness to pay for food carbon label: social norms and environmental concerns. Food. Policy. 2024, 128, 102690.
49. Aung, M. M.; Chang, Y. S. Traceability in a food supply chain: safety and quality perspectives. Food. Control. 2014, 39, 172-84.
Cite This Article
How to Cite
Download Citation
Export Citation File:
Type of Import
Tips on Downloading Citation
Citation Manager File Format
Type of Import
Direct Import: When the Direct Import option is selected (the default state), a dialogue box will give you the option to Save or Open the downloaded citation data. Choosing Open will either launch your citation manager or give you a choice of applications with which to use the metadata. The Save option saves the file locally for later use.
Indirect Import: When the Indirect Import option is selected, the metadata is displayed and may be copied and pasted as needed.
About This Article
Copyright

Data & Comments
Data
0


Comments
Comments must be written in English. Spam, offensive content, impersonation, and private information will not be permitted. If any comment is reported and identified as inappropriate content by OAE staff, the comment will be removed without notice. If you have any queries or need any help, please contact us at [email protected].