

Uncovering the evolution of the public climate finance policy mix for renewable energy in China
 0
0 Abstract
As a critical element for energy transition and carbon neutrality, climate finance is receiving increasing attention from policymakers. However, existing studies mainly focus on the environmental economic performance of individual climate finance policy instruments, with limited discussion on the policy mix rationale. To uncover the evolutionary dynamics of public climate finance policy mix and understand its underlying mechanisms in facilitating low-carbon transition, this paper systematically examined the policy documents released from 2006 to 2023 in China. The results indicate that since the enactment of the Renewable Energy Law, China has introduced 121 public finance policy documents to support renewable energy development, marking a gradual shift from government-led subsidy policies to a market-based green electricity trading scheme. The policy mix dynamics vary across different phases: Phase I (2006-2010) witnessed a predominant utilization of special funds, Phase II (2011-2016) focused on the establishment and implementation of feed-in tariffs, while Phase III (2017-2023) marked a transition toward market-based policy instruments. Overall, China's experience shows that a comprehensive array of policy instruments, rather than relying on a single tool, is necessary for facilitating a low-carbon transition. Instead of prescribing an optimal combination of policy instruments once and for all, it is crucial to dynamically adjust and calibrate these instruments over the long term. This study not only assists China in exploring an appropriate policy mix for energy transition and carbon emission reduction, but also provides valuable references for other countries with similar development modes.

Keywords
INTRODUCTION
The energy sector is responsible for around three-quarters of global greenhouse gas (GHG) emissions, and thus reducing GHG emissions across the full energy sector is especially important for global carbon neutrality. Renewables will contribute most to decarbonizing electricity, with the share of renewables in total electricity generation increasing from 29% in 2020 to nearly 90% in 2050[1]. The renewable energy sector, which requires the largest amount of financing, attracts the majority of the public climate finance flows. In 2021/2022, it is estimated that the energy system received 252 billion USD (39%) of global public climate finance[2]. China possesses the world’s largest renewable energy capacity, exceeding 1.5 billion kilowatts and accounting for approximately 40% of the global total in 2023[3]. Over the past years, China has effectively allocated public climate finance to stimulate the rapid development of renewable energy, resulting in remarkable success. The public climate finance policies help reduce the production cost and investment threshold of the renewable energy enterprises, alleviate the competitive disadvantages in technology and cost in the early stage, and therefore promote the rapid growth of the renewable energy industry. The policy mix of public climate finance plays a crucial role in informing, guiding, and accelerating investment in China’s renewable energy sector. A comprehensive set of public climate finance policy instruments, rather than a single policy instrument, has been coherently implemented and dynamically adjusted, including subsidies, special funds, tax incentives, concessional loans, etc.[4].
Previous studies have extensively evaluated the effectiveness of the climate finance policy instruments at both empirical and theoretical levels. However, most of these studies primarily focus on individual policy instruments, and little attention has been paid to the policy mix and the underlying mechanisms. While providing important insights, these studies do not shed light on the interactions between different policy instruments and the appropriate policy mix options. Investigating how policy mixes evolve over time is a promising research direction for contemporary policy design studies[5]. The need to better understand temporal factors and the real-world evolution of policy mixes has been increasingly emphasized[6].
Therefore, this paper takes China’s renewable energy sector as a case study to explore the evolutionary dynamics of the policy mix for public climate finance and its underlying mechanism in facilitating energy transition. Through a systematic review of the national policy documents from 2006 to 2023, we divide the evolution process into three phases and thoroughly analyze the policy mix. This study aims to address the following questions: (1) What are the temporal dynamics and the distinctive characteristics of the public climate finance policy? (2) How is the policy mix dynamically adjusted in response to the renewable energy development? (3) What are the underlying mechanisms and interactions among different policy instruments?
This study makes contributions from both theoretical and practical perspectives. Firstly, in contrast to existing research that predominantly focuses on the effectiveness of individual climate finance policies, this study introduces a comprehensive policy mix analysis framework that incorporates different kinds of climate finance policies. This novel approach offers a fresh perspective that enables a more systematic and profound understanding of the climate finance policies. Secondly, through careful examination of policy documents, this study systematically uncovers the temporal dynamics of climate finance policy portfolios and their adaptive mechanisms dynamically calibrated to renewable energy growth trajectories, highlighting threshold effects in policy alignment across varying technological maturity stages. Thirdly, this study explores the interactions between different climate finance policies and the fundamental rationale of the policy mix. The findings not only reveal the potential dynamics and challenges in climate finance policy formulation, but also provide valuable insights for global and national efforts toward renewable energy deployment and low-carbon transition within the framework of comprehensive climate policy.
The rest of the article is structured as follows. Section "LITERATURE REVIEW" provides a comprehensive review of previous studies of climate finance policy and policy mix. Section "METHODOLOGY" describes the analytical framework, the data and methods used. Section "EVOLUTION AND ANALYSIS OF THE PUBLIC CLIMATE FINANCE POLICY MIX IN THE RENEWABLE ENERGY SECTOR" traces the evolution of public climate finance policy mix in China’s renewable energy sector between 2006 and 2023, providing an in-depth analysis of policy changes over time. Section "DISCUSSION" discusses trends in renewable energy development and offers insights into the climate finance policy mix. Section "CONCLUSION" summarizes the study with conclusions and policy implications.
LITERATURE REVIEW
Climate finance policy is a nascent area within the broader realm of climate policy. This section presents a comprehensive literature review on the pivotal role of climate finance policy, the effectiveness and mechanism of individual climate finance policy, and the preliminary exploration into the policy mix of climate finance.
As a market-based instrument, climate finance policy has the advantage of dealing with market failures. More and more governments worldwide are embracing them as a key part of their climate policy package. Generally speaking, climate finance policy can be combined with many climate policies to generate positive synergy, e.g., renewable energy policy, innovation support policy, and information provision[4]. To be specific, empirical studies at both the national and sectoral levels confirm the pivotal role of climate finance policy. At the national and supernational levels, Lam and Mercure developed an evolutionary technology diffusion model to simulate the impact of climate policies on passenger car emissions in five countries, showing that combining electric vehicle mandates with taxes and regulations on combustion vehicles is highly effective[7]. Li et al. used a difference-in-differences approach to assess China’s current carbon-abatement policies (i.e., energy-saving goals, new energy subsidies, and carbon emission trading schemes), and analyzed the channels involved from the perspective of investment preferences[8]. Zhang et al. evaluated the impact of single carbon tax and combined policy mixes with a new multi-country computable general equilibrium model, indicating that integrated policy mixes can improve both cost-effectiveness and emission performance compared to carbon tax alone[9]. At the sectoral level, Axsen et al. explored the climate policies and policy mixes for road transport in relation to 2030 and 2050 mitigation goals, arguing that pricing mechanisms should be combined with stringent regulations[10]. Bhardwaj et al. compared several policies in terms of effectiveness and mitigation costs, suggesting that policymakers implement carbon pricing as stringently as politically feasible, complemented by regulations as needed to meet GHG targets[11]. Savin et al. demonstrated that the main limitations of carbon pricing are low public support and global harmonized implementation[12].
Existing studies on climate finance policy mainly focus on the multiple effectiveness of individual policy instruments from theoretical and practical perspectives. On the one hand, performance indicators are designed to evaluate climate finance policies. International institutions including UNFCCC (United Nations Framework Convention on Climate Change), IEA (International Energy Agency), and MDBs (Multilateral Development Banks) have designed diversified performance indicators in terms of mitigation, adaptation, costs, benefits, risks, etc., among which the most popular indicator is the carbon emission reduction[2,13-15]. Some studies design the performance indicators for specific climate finance instruments. For example, de Souza Cunha et al. designed the Carbon Efficient Index to evaluate the performance of low-carbon investments in the Brazilian stock market[16]. On the other hand, quantitative methods including top-down, bottom-up, and econometrics are extensively used to evaluate the effectiveness of climate finance policies. Goulder et al. designed a multi-sector multi-period general equilibrium model to assess the potential impacts of China’s national emission trading system with expanded sectors covered, in terms of emission reductions, climate-related benefits, health benefits, and transition to renewables-based electricity[17].
The term “policy mix” refers to cases where policymakers use bundles of policy instruments that are expected to attain policy goal(s) more efficiently and effectively than using a single instrument[21,22]. Existing studies first investigate the policy mix adopted and how that policy mix has evolved. Skjærseth examined the development of climate and energy policies from separate and narrow initiatives to coordinated policy packages to achieve increasingly ambitious climate targets, culminating with the European Green Deal[23]. Chen et al. captured the evolution of both the narrative temporality and the verticality of environmental policy mixes, drawing upon the case of agricultural residue recycling in China[24]. Ma et al. analyzed how four types of policy relevant to carbon city development - hierarchy, market-based, network-oriented, and information-based - can be integrated into a policy mix and contribute to the effective realization of low-carbon cities[25]. Additionally, policy mix studies extensively describe the interactions between different climate-related policies. Li and Taeihagh identified five types of interactions among policy instruments: precondition, facilitation, synergy, potential contradiction, and contradictions[5]. van den Bergh et al. distinguished four cases of interaction between climate policy instruments, namely no (zero) synergy, positive synergy, (moderately) negative synergy, and backfire[4]. Pahle further analyzed the relationship between different carbon pricing instruments and proposed the best choice in a socially fair way for the EU road transportation transition[26]. Furthermore, based on the understanding of policy interactions, some preliminary climate finance studies have discussed the notion of policy mix and the need for integrated policy making. Some scholars discussed the principles and concepts for climate finance policy mixes in accordance with climate change targets. Edmondson et al. theoretically analyzed the framework for the policy mix evolution and socio-technical system transition[27]. Sun discussed the ideas for an innovative and coherent policy system to promote climate investment and finance in China[28]. Other studies aimed to propose potential climate finance policy mixes based on quantitative estimation. Migo-Sumagang et al. used mixed integer linear programming to develop the optimal investment portfolio of negative emission technology for the period 2020-2100[29]. Duan and Yang designed the policy mix to achieve China’s 2030 carbon dioxide peaking and non-fossil energy targets, suggesting that the carbon pricing policy be complemented by subsidies[30]. Some studies further discussed the factors that influence the effectiveness of policy mixes. Qiu et al. explored the optimization of demand-side policy mixes from the perspective of residential preference heterogeneity with 18 electric vehicle (EV) pilot cities in China as the case study[31]. Wang et al. empirically examined the impacts of different types of industry policies and their mixes on enterprise innovation based on dual perspectives of regional innovation environment and enterprise ownership[32].
In summary, while existing scholarship has extensively examined the critical functions of climate finance policies and evaluated the efficacy of singular policy instruments, three research gaps persist in addressing their real-world composite nature. Specifically, climate finance policy inherently operates as a policy mix comprising heterogeneous instruments rather than a standalone tool. The current literature inadequately explores: (1) the theoretical foundations for multi-instrument combinations under practical constraints; (2) the synergistic and conflicting interactions among co-deployed mechanisms; and (3) the evolutionary dynamics of policy mix across policy development phases. This oversight leaves critical blind spots in understanding how fiscal incentives, market architectures, and technological enablers collectively shape climate financial systems through their polycentric interplay. Notably, China's climate finance policy mix has demonstrated empirical validity in accelerating renewable energy deployment, providing crucial case-specific insights for addressing research gaps. Therefore, we conduct a systematic analysis of China's renewable energy sector as a case study from 2006 to 2023. Our goal is to uncover the evolutionary dynamics of public climate finance policy mix and understand its underlying mechanisms in facilitating the low-carbon transition. This study will not only assist China in exploring an appropriate climate policy mix for energy transition and carbon emission reduction, but also provide valuable references for other countries with similar development modes.
METHODOLOGY
Analytical framework
Figure 1 displays the analytical framework of public climate finance policy mix in China’s renewable energy sector. Policy instruments, also known as policy tools or measures, are the building blocks of a policy mix[33]. There are many classifications of environmental and climate policy instruments. For example, Hood and Margetts generally classified policy instruments into four categories based on the use of governing resources: nodality, authority, treasure, and organization[34]. Li and Taeihagh further proposed an energy transition policy mix containing three policy strategies: reducing CO2 emissions, promoting renewable energy technologies, and controlling air pollution[5]. van den Bergh et al. focused on five types of instruments from the policy synergy perspective: performance and technical standards, carbon pricing, adoption subsidies, innovation support, and information provision and nudges[4].

Figure 1. Analytical framework of public climate finance policy mix in China’s renewable energy sector.
Here, we focus on a set of public climate finance policy instruments that have been implemented in China’s renewable energy sector, which we classify into five categories according to policy function and characteristics, i.e., special funds (SF), tax incentives (TI), feed-in tariffs (FIT), policy funds (PF) and green electricity certificate (GEC). SF provide public financial support for specific types of renewable energy projects. TI typically involve tax reductions or exemptions to encourage the adoption of renewable energy facilities and power generation. FIT are a common subsidy mechanism, in which the price gap between renewable electricity and coal-fired electricity is subsidized. PF represent another form of public financial support, distinct from SF. While SF are generally arranged through the central government budget - via investment plans, ultra-long-term special treasury bonds, non-repayable grants, or interest subsidies - PF operate under a market-based operation model. They are usually required to repay the principal and interest, similar to commercial financing. GEC aim to internalize the environmental benefits of renewable energy by reflecting them in electricity prices, which is typically achieved through the creation of a green certificate trading market.
The rationale behind a policy mix lies in the systematic process of policy packaging. Temporally, Thelen introduced five distinct mechanisms of public policy change: replacement, layering, drift, conversion, and exhaustion. Replacement occurs when new institutions take the place of existing ones. Layering involves the gradual addition of new components to existing institutions. Drift refers to the situation where institutions remain unchanged despite shifts in the broader institutional environment, leading to their gradual erosion. Conversion entails repurposing existing institutions to serve new purposes. Exhaustion denotes the gradual deterioration of institutions over time[35]. Moreover, interactions often occur between different policy instruments. Following the research in[36], this paper identifies three types of interactions: facilitation, positive synergy, and contradiction. Facilitation occurs when the successful implementation of one policy instrument enhances the effectiveness of another. Positive synergy refers to mutual reinforcement between two policy instruments, where each “facilitates” the other. Contradiction arises when two policy instruments generate “strictly” conflicting outcomes or incentives.
The temporal-structural analysis reveals that these instruments constitute an evolving policy mix, examined in this study through a triphasic developmental trajectory. Phase I (2006-2010) is characterized by the dominance of the SF policy instrument. Phase II (2011-2016) marks the establishment of the FIT, which becomes the most significant policy instrument during this period. In Phase III (2017 and 2023), market-based instruments such as the GEC gain increasing importance.
Data and method
This study examines the development of the public climate finance policy mix in China’s renewable energy sector during 2006-2023. First, policy documents were collected from the official websites of relevant Chinese government ministries and commissions and the Peking University legal database (https://www.pkulaw.com/). Given that the central government is the primary policy-making body in climate finance and renewable energy in China, the search was limited to national-level policy documents released by key departments, such as the Ministry of Finance, the National Development and Reform Commission, and the National Energy Administration. Local government documents were excluded, as local authorities primarily serve as policy implementers rather than policymakers. A set of climate finance-related keywords was used to retrieve relevant policy documents. After removing duplicates and conducting a preliminary screening, a total of 121 policy documents from 2006 to 2023 were selected. The starting point of this time window was chosen because the Renewable Energy Law - China’s basic law for the development and utilization of renewable energy - came into force on January 1, 2006. Second, the collected documents were manually coded and the extracted information was recorded using an Excel spreadsheet. Third, the policy documents were grouped into three distinct time periods: 2006-2010, 2011-2016, and 2017-2023. Within each period, the documents were analyzed thoroughly to examine the evolution of the policy mix and the development of five categories of policy instruments. Finally, an in-depth analysis was conducted to explore the interactions among different policy instruments and the mechanisms within the policy mix. The detailed search method and coding framework used to summarize each policy document are presented in
EVOLUTION AND ANALYSIS OF THE PUBLIC CLIMATE FINANCE POLICY MIX IN THE RENEWABLE ENERGY SECTOR
Since the enactment of the Renewable Energy Law in 2006, the Chinese government has allocated substantial climate finance to support the development of renewable energy. Figure 2 illustrates the three stages of China’s public climate finance policy mix in the renewable energy sector from 2006 to 2023, along with key policy modifications (For a more comprehensive description of the evolution of the policy mix during

Figure 2. Evolution of the public climate finance policy mix in the renewable energy sector.
Temporal dynamics and distinctive characteristics of the policy mix
This section provides an overview of the policy mix at each stage, including its general profile, distinctive characteristics, policy interactions, and impact on renewable energy development.
Phase I (2006-2010): predominant use of SF
Figure 3 summarizes the public climate finance policy mix during Phase I (2006-2010). At this stage, the Chinese government established foundational legislation, goals, and strategies for renewable energy development. Following the formal enactment of the Renewable Energy Law in 2006, the "Medium- and Long-Term Development Plan for Renewable Energy" was formulated in 2007, committed to establishing a complete renewable energy technology and industrial system by 2020. This elevated renewable energy development to a national strategic priority, culminating in the release of the first dedicated Five-Year Plan in 2008. Detailed policy documents related to renewable energy project management and electricity pricing were introduced in alignment with these macro-level policies. Under this framework, the Chinese central government has promulgated over 30 climate finance policy documents articulating three policy instruments: SF, PF, and FIT. These instruments strategically converge to mobilize capital toward renewable energy infrastructure while ensuring revenue stability for power generation assets through institutional safeguards. Among these instruments, SF played a dominant role, providing substantial financial support in the form of grants and loan subsidies for renewable energy building, power generation, and oil substitution projects. In 2006, the Ministry of Finance (MOF) formulated the overarching policy framework for SF and subsequently issued specific policies tailored to various subfields, including renewable energy in buildings, biomass energy, marine renewable energy, etc. Additionally, in 2006, the State Council authorized the establishment of the Clean Development Mechanism (CDM) Fund, financed by revenue from CDM projects. The CDM Fund functioned as a PF instrument and was disbursed through grants and reimbursable loans. Furthermore, China started to adopt the widely used FIT policy to determine appropriate pricing for renewable electricity. FITs were targeted at projects involving wind, solar, ocean, geothermal, and biomass power.

Figure 3. Policy mix in Phase I (2006-2010).
During Phase I, the three types of policy instruments exhibited positive interactions in promoting renewable energy development. On the one hand, SF and FIT exhibited positive synergies, with their combined implementation producing mutually reinforcing effects. Specifically, SF primarily supported the capital-intensive installation phase by providing upfront financial subsidies for designated renewable energy infrastructure projects. In parallel, FIT functioned as an operational guarantee mechanism by offering fixed premium electricity prices, thereby ensuring long-term revenue streams during the operational phase. This dual policy structure stimulated both technological adoption through infrastructure development and market penetration via generation incentives. The interaction between these mechanisms created a positive feedback loop: improved technological adoption led to higher generation efficiency, which in turn enhanced the economic viability of FIT. This dynamic established a self-reinforcing cycle that further accelerated renewable energy deployment and utilization. On the other hand, PF was a useful supplement to both SF and FIT, and vice versa. Eligible projects obtained not only incentive-based financial support from SF and FIT but also concessional financing through PF. Together, these public finance policies played a crucial role in the rapid development of renewable energy in China. In 2010, installed wind power capacity reached
Phase II (2011-2016): establishment and implementation of FIT
Figure 4 illustrates the public climate finance policy mix during Phase II (2011-2016). At this stage, China released its 12th and 13th Five-Year Plans for renewable energy development in 2012 and 2016, respectively, clearly outlining the goals, tasks, and strategic layout. In addition, the National Climate Change Plan

Figure 4. Policy mix in Phase II (2011-2016).
Similar to Phase I, both SF and FIT policies demonstrated a significant positive synergy in Phase II, indicating that the implementation of either SF or FIT enhanced the effectiveness of the other. Together, SF and FIT provided comprehensive financial support for wind, solar, and biomass energy, from the installation side and the power generation side, respectively. Additionally, TI instruments mutually reinforced the effects of both SF and FIT. Qualified renewable energy equipment manufacturers and power producers not only benefited financially from SF and FIT but also reduced production costs through TI support. These combined incentives were particularly crucial for the rapid growth of renewable energy enterprises. As a result of these sustained policy efforts, China has made significant strides toward building a sustainable energy system. The country now ranks first globally in cumulative wind and solar power capacity, contributing significantly to the global growth of renewable energy. Wind electricity production increased from 80 billion kWh in 2011 to 241 billion kWh in 2016, while solar electricity production increased from 8.37 billion kWh in 2013 to 66.2 billion kWh in 2016. Further quantitative research has confirmed that FIT helps reduce carbon emissions by expanding the share of renewables and displacing traditional electricity production[38].
Phase III (2017-2023): transition to market-based policy instruments
Figure 5 demonstrates the public climate finance policy mix during Phase III (2017-2023), a period marked by significant macro-level changes. First, in September 2020, China announced its ambitious Dual Carbon Goals. This was followed by the release of the 14th Five-Year Plan for renewable energy development in 2021, which introduced the goal of building a New Electric Power System Based on New Energy Sources. Second, in the early stages of the 14th Five-Year Plan, wind and solar power generation entered the era of grid parity. As a result, the earlier project management approaches - largely dependent on electricity price subsidies to promote, guide, and regulate market scale and project layout - required fundamental transformation. Third, power system reforms accelerated, making the participation of renewable energy sources such as solar power in the electricity market inevitable. Finally, renewable energy development had long relied on subsidies, resulting in a significant funding shortfall due to limited funding sources. Accordingly, the primary policy objective during this phase shifted to closing the substantial subsidy gap and enhancing the capacity for renewable electricity consumption, which remained insufficient relative to the amount of electricity generated. Over 40 policy documents were released in quick succession, covering four types of policy instruments: FIT, GEC, SF, and PF. As in Phase II, FIT remained the dominant policy instrument; however, benchmark prices and tariffs were gradually decreased, and eligibility criteria for projects became increasingly stringent. Starting in 2021, the central government stopped providing subsidies for newly established centralized solar projects, industrial and commercial distributed solar projects, and onshore wind power projects - signaling the official start of the grid parity era. Meanwhile, the GEC mechanism was piloted in 2017 for onshore wind and centralized solar power trading. By 2023, it had evolved into a comprehensive trading system covering all types of renewable electricity. The gradual phase-out of FIT alongside the implementation of GEC signaled a shift from government-led policy instruments to market-based mechanisms. Furthermore, revised versions of the SF and PF policies were introduced to support specific categories of clean energy projects.

Figure 5. Policy mix in Phase III (2017-2023).
The interactions among policy instruments in Phase III were significantly more complicated than in the previous two stages. First, a conflicting relationship existed between FIT and GEC: A renewable energy project could either receive FIT subsidies or be authorized to participate in the GEC scheme, but not both. Second, there are two sets of mutually reinforcing (synergistic) policy pairs: FIT and SF, GEC and PF. As in Phases and II, eligible projects could receive financial support through FIT and SF, which exhibited positive interaction effects. Additionally, the two market-based instruments - PF and GEC - provided financial support from different angles: PF supported renewable energy installations, while GEC incentivized power generation. Together, they created a synergistic effect in promoting renewable energy development. Third, three additional pairs exhibited mutual facilitation effects: FIT and PF, GEC and SF, SF and PF. The strength of these facilitative effects depended on the duration of policy implementation. For newly introduced or recently revised policies such as GEC and PF, the facilitative impacts were limited over shorter timeframes. With this comprehensive set of policy instruments, China’s renewable energy industry has become increasingly competitive and now plays a key role in the global expansion and cost reduction of renewable energy technologies. Between 2010 and 2020, global renewable power capacity increased from 754 to 2,799 GW, while electricity generation rose from 761 to 3,147 TWh. During the same period, the average levelized cost of electricity (LCOE) declined by 85% for centralized solar photovoltaic, 64% for solar thermal, 56% for onshore wind, and 48% for offshore wind. Quantitative estimates using China’s provincial panel data from 2006 to 2019 further demonstrate that the implementation of GEC significantly reduced carbon intensity in the power sector. Specifically, a 1% increase in GEC intervention intensity corresponded to a 0.304% decrease in carbon intensity[39].
In-depth analysis of policy evolutionary dynamics for SF and FIT
This section presents an in-depth analysis of the evolutionary dynamics of the two most influential policy instruments: SF and FIT.
SF facilitated the scale-up of renewable energy deployment
The SF policy played a pivotal role during the first two stages, with approximately 40 policy documents released within a span of 10 years. Figure 6 depicts the policy evolution related to SF. These documents include both overarching frameworks and detailed regulations across four subfields. The overarching framework was revised twice to better align with evolving support priorities. The first version, released in 2006, mainly focused on renewable energy building, renewable energy generation, and oil substitution. The second version, introduced in 2015, emphasized renewable and new energy sources. The third version, published in 2020, shifted support toward renewable energy as well as the cleaner development and utilization of energy sources. Financial support under the SF policy initially followed an upward trajectory, peaking at around 2.65 billion USD in 2015. Thereafter, it declined gradually to roughly one-third of this amount (reaching between USD 0.72-0.87 billion).
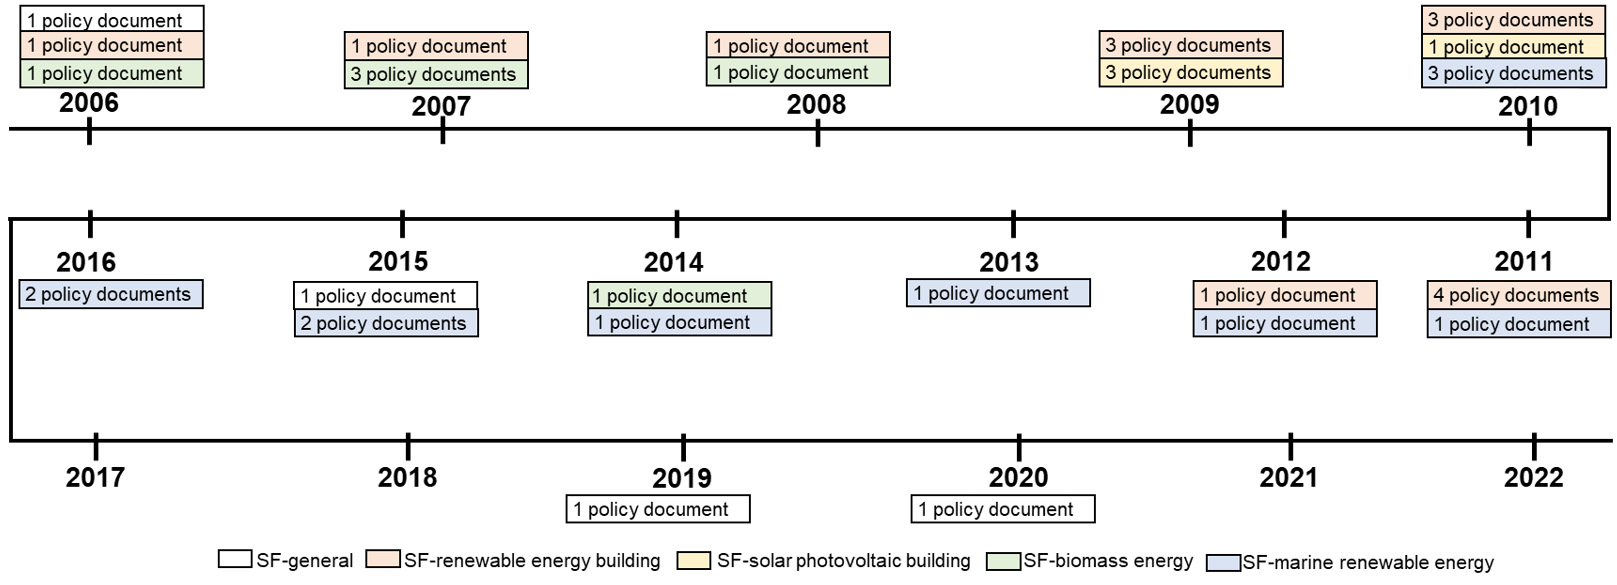
Figure 6. The policy change process of SF.
The policy evolution across the four subfields reflects the central government’s flexible and prompt response to real-world challenges. Policymakers deliberately employed mechanisms such as replacement, layering, conversion, and exhaustion to patch flaws in the existing institutional scheme. First, the renewable energy building sector was initially the primary focus, with the SF providing financial support for project-level demonstration applications. This support was later extended to both urban and rural areas at the city and county levels, accompanied by strengthened post-implementation fund control measures. These efforts led to a rapid increase in renewable energy building applications, along with gradual technological improvements and increased competitiveness. Second, to further promote solar building applications, the "Solar Roof Programme" and the "Golden Sun Project" were launched in 2009, offering subsidies for installation. However, several issues emerged during implementation, such as fraudulent practices by some enterprises to obtain subsidies, insufficiently stringent acceptance criteria and regulatory oversight, and limited effectiveness in subsidizing power generation. Consequently, both programs were terminated after only 1-2 years of operation. Third, biomass energy was included as a supported subfield under the SF since 2006. However, concerns arose regarding the production of fuel ethanol from food-based feedstocks and the competition for land with food production. In response, administrative policies were promptly introduced to steer the development of bioenergy toward the use of non-food raw materials. The subsidy standard for biomass energy was gradually reduced and ultimately eliminated in 2016. Lastly, the SF has consistently supported marine renewable energy. Each year, the State Oceanic Administration issued project solicitation guidelines or tender invitations to select qualified projects. Detailed administrative rules were meticulously designed and revised to ensure the proper use of funds.
FIT contributed to cost reductions in renewable energy
China has established a comprehensive FIT policy scheme, with a total of 70 policy documents issued between 2006 and 2023. In terms of governance, the MOF played a leading role, supported by the National Development and Reform Commission (NDRC) and the National Energy Administration (NEA). The MOF was responsible for financial resource allocation, while the NDRC and NEA oversaw the FIT subsidy catalog and the renewable energy tariff surcharge. The policy framework was formalized through an overarching interim measure introduced in 2012 and revised in 2020. A series of supplementary policy documents further refined the FIT subsidy catalog, the tariff surcharge levy, and the FIT rates for wind and solar power. In practice, the FIT policy was implemented through four main steps: (1) batch issuance of subsidy catalogs; (2) application for subsidies; (3) quarterly advance allocation of subsidies; and (4) year-end liquidation procedures. The primary source of these subsidies came from renewable energy tariff surcharge revenues, in accordance with FIT regulations.
With the rapid development of renewable energy and the increasing demand for FIT subsidies, the policy scheme underwent significant adjustments, particularly regarding FIT rates for wind and solar power, the tariff surcharge, and the subsidy catalog. First, substantial changes were made to FIT levels. The NDRC initially set relatively high benchmark tariffs for wind power and solar power in 2009 and 2011, respectively. However, these tariffs were gradually reduced and eventually phased out. In 2019, a pilot program was launched to implement grid parity tariffs. From 2021 onward, no subsidies were provided for newly registered centralized solar power stations, industrial and commercial distributed solar projects, or onshore wind power projects. Second, the renewable energy tariff surcharge increased from 0.2 cents/kWh in 2006 to 0.4 cents/kWh by the end of 2009, and then to 0.8 cents/kWh in 2011. It was further raised to 1.5 cents/kWh in 2013 and 1.9 cents/kWh in 2016, remaining at that level thereafter. Since 2020, FIT subsidy expenditures have been allocated based on actual tariff surcharge revenues. Third, a total of seven FIT subsidy catalogs were approved before 2018. After 2018, only three batches of solar poverty alleviation projects were issued. The issuance of FIT subsidy catalogs was discontinued after 2020 and replaced by an online application and review process managed by grid enterprises. Over time, the subsidy catalog demonstrated a trend toward increasingly stringent criteria.
The comprehensive FIT policy significantly contributed to reducing the cost of renewable energy technologies in China, which in turn played a major role in driving down global renewable power generation costs [Figure 7]. Between 2010 and 2022, the levelized cost of electricity (LCOE) for onshore wind and solar power in China decreased by 66% and 89%, respectively - comparable to global reductions of approximately 68% and 89%, respectively[40]. In 2022, the LCOE for onshore wind and solar power in China was 18% and 24% lower than the global average, respectively. Additionally, the average LCOE for offshore wind power in China has reached around 0.049 USD/kWh, equivalent to the cost of onshore wind power in 2017. Projections indicate that the average LCOE for offshore wind power in China will decline by an additional 19%-23%, reaching around 0.037 USD/kWh in 2030[41].

Figure 7. Levelized cost of electricity (LCOE) of wind and solar power in China and worldwide (2010~2022). Source: IRENA, Renewable Power Generation Costs.
DISCUSSION
China’s promotion of high shares of renewable energy to achieve carbon neutrality
Establishing a power system with a high share of renewable energy is essential for China to achieve its carbon neutrality targets. Under the 2 and 1.5 °C scenarios, it is projected that the installed capacity of non-fossil energy in China will reach 5.3 and 5.9 TW, respectively, accounting for approximately 90.4% and 91% of the energy mix[42]. A multi-model comparative analysis suggests that by 2060, the installed capacities of wind and solar power will reach approximately 3,043 and 2,210 GW, respectively - up to seven times their respective capacities in 2022[43]. Compared to the current power system, the future power system will undergo transformations in four key aspects: (a) the functional role will shift from merely supporting economic and social development to also driving industrial upgrading; (b) the most reliable source of power supply will turn to renewable energy instead of fossil fuels; (c) energy storage will be incorporated as a fourth key component - alongside source, grid, and load - facilitating the integration of diverse renewable technologies into the grid; and (d) the regulation and operation mode will evolve from load-based source to intelligent, interactive coordination among all components[44].
Developing a power system with a high share of renewables will require not only increased investment in generation capacity but also substantial investments in grids, loads, and secondary systems. Preliminary estimates indicate that investment in the power sector (including sources, energy storage, and power grids) will reach approximately USD 15.95 trillion under the CO2 neutrality scenario and USD 16.96 trillion under the GHG neutrality scenario. This translates to average annual investments of about USD 0.40 trillion and USD 0.42 trillion, respectively [Figure 8]. Although China currently leads global renewable energy investment, with USD 274 billion (about RMB 1.8 trillion) invested in 2022, a significant funding gap remains.

Figure 8. Forecast of gross energy transition investment in China’s power sector. Source: Tsinghua University, 2023.
Climate finance policy must be critically adjusted to achieve long-term objectives
The construction of a novel power system must address key challenges such as large-scale deployment, high-level integration of renewable energy, and ensuring a safe and reliable electricity supply, which urgently requires substantial innovation in public climate finance policies.
Optimizing the focus areas and mechanisms of SF policy
Although the SF policy was tightened during Phase III, it remains a vital tool for supporting the sustainable development of the renewable energy sector. Regarding focus areas, two categories will be prioritized. This first includes renewable energy projects that make significant contributions to carbon emission reduction and carbon peaking targets - such as deep-sea wind power, biomass energy, and geothermal energy. The second includes projects that facilitate the integration and consumption of a high share of renewable energy, such as advanced energy storage facilities and pumped-storage hydropower plants. In terms of funding mechanisms, there will be a shift from direct investment toward more diversified approaches. For example, eligible public welfare renewable energy projects will be supported through local government bonds, and market-oriented investment mechanisms will be promoted for low-carbon energy infrastructure projects. In practice, the SF will follow an "income-to-expenditure" principle, leveraging existing funding channels to facilitate the development of new energy sources.
Reinforcing the transition from authority-based FIT to market-based GEC
GEC is specifically designed to meet renewable energy generation quota targets through tradable green certificates and has been widely adopted in many countries. In 2017, China launched a pilot GEC trading system for onshore wind and centralized solar power. In 2023, this initiative was expanded into a comprehensive trading system covering all types of renewable energy. With the cancellation of the authority-based FIT policy, the market-based GEC scheme will replace FIT to facilitate the development of renewable energy. The GEC serves as an effective policy tool across various scenarios, including validating renewable energy consumption, supporting green electricity trading, and promoting international recognition of green certificates. Key actions for successful implementation involve strengthening interdepartmental collaboration, ensuring policy coherence with other market-based mechanisms, and enhancing policy synergies.
Introducing financial policy instruments to leverage private finance
Financial policy instruments are well-suited to mobilize private capital and serve as effective complements to public financing tools. Recently, the Chinese government has introduced several innovative financial instruments, such as the Carbon Emission Reduction Support Tool, a monetary policy mechanism launched in 2021. This tool offers low-cost financial support for loans in three priority areas: clean energy, energy conservation and environmental protection, and carbon reduction technologies. By the end of 2023, the outstanding balance of this tool had reached USD 78.4 billion. In addition, new financing models have been promoted. For instance, Infrastructure Real Estate Investment Trusts (REITs) were piloted in 2020 to support energy infrastructure projects, including hydropower, wind power, solar power, and pumped-storage power stations. This financing mechanism aims to address challenges such as inconsistent investment benefits, limited financing channels, and difficulties in capital exit. Furthermore, enhancing public-private financing cooperation is encouraged. Public finance primarily plays a policy-driven role in areas requiring government guidance - such as key technology research and development and infrastructure construction - while private capital is typically directed toward mature commercial projects.
CONCLUSION
As a critical driver for the energy transition, climate finance has garnered increasing attention from policymakers. Aiming to explore the dynamics of climate finance policy, this study examined the evolution of the public climate finance policy mix that promoted the rapid growth of renewable energy in China during 2006-2023. The policy mix was categorized into five types of policy instruments, and its chronological development was analyzed through a review of relevant policy documents and literature.
The findings demonstrate that, since the enactment of the Renewable Energy Law, China has introduced 121 public finance policy documents to support renewable energy development between 2006 and 2023. The density and intensity of the policy instruments remained consistently high, with over 30 to 40 policy documents released at each stage. Over time, China's renewable energy public finance policies have gradually shifted from government-led subsidies to market-based green electricity trading schemes. The policy strategies and characteristics of the mix varied across different phases: Phase I (2006-2010) was dominated by SF; Phase II (2011-2016) emphasized the establishment and implementation of FIT; and Phase III (2017-2023) marked a transition toward market-oriented instruments. Among the five policy instrument types, SF and FIT hold significant importance, with approximately 40 and 70 policy documents issued, respectively. The evolution of these two instruments reflects the central government's flexible responses to real-world challenges. As a result of these public finance policies, China has significantly expanded its renewable energy capacity and reduced the costs of renewable energy technologies. These achievements have contributed substantially to global renewable energy development.
The overall evolution of China’s public climate policy mix in the renewable energy sector provides valuable insights for other developing countries seeking to promote energy transitions and carbon neutrality. First of all, central governments should pay high attention to the development of renewable energy. In response to the rapidly increasing energy demand of the 21st century, the Chinese government actively promoted the deployment and utilization of renewable energy as a core component of its high-level strategy to improve the energy structure and ensure energy security. A top-down policy system for renewable energy was gradually established, encompassing national targets, technology research and development, standards and norms, fiscal and tax policies, and feed-in tariffs. Moreover, adopting a comprehensive array of policy instruments, rather than relying on a single tool, is necessary for facilitating a low-carbon transition. Instead of prescribing an optimal, fixed combination of policy instruments, it is crucial to dynamically adjust and calibrate them over time. Policy evolution processes such as replacement, layering, drift, conversion, and exhaustion often unfold as part of a complex and adaptive policy mix. Furthermore, renewable energy development should be closely linked to the improvement of livelihoods. Many renewable energy projects have been integrated into national and local development plans in China. These initiatives have not only provided electricity to about 300,000 rural households in remote western areas, but also driven the growth of China's solar industry. As a result, the concept of renewable energy has gained widespread public recognition, and its technologies have been adopted on a large scale.
Although this paper enriches the literature on the climate finance policy mix, some limitations deserve further investigation. First, this study focuses exclusively on climate finance policies in the renewable energy sector and does not cover the full range of policy instruments related to China’s broader climate finance framework. More comprehensive research on climate finance policies across both the public and private sectors would be valuable. Second, although this paper discusses interactions among different types of policy instruments, a more detailed and in-depth analysis using policy mix theory and climate finance theory could offer additional insights into these interactions. Third, in the era of artificial intelligence, it would be worthwhile to apply modern machine learning methods to systematically analyze the full textual content of policy documents, map their structures, and explore in-depth policy characteristics and interactions. Available methods include, but are not limited to, Structural Topic Modelling and Latent Dirichlet Allocation[45,46]. Finally, quantitative evaluations of policy mix effectiveness (e.g., carbon emission reduction) using either bottom-up or top-down methods, as well as modeling and optimization of policy portfolios, will provide a more comprehensive and in-depth understanding of the actual energy policy system.
DECLARATIONS
Authors’ contributions
Conceptualization: Zeng, A.; Tan, X.
Data collection and analysis: Zeng, A.; Liu, Y.; Xing, X.
Results analysis: Xiong, X.
Manuscript writing: Zeng, A.; Liu, Y.
Manuscript review and editing: Tan, X.; Xiong, X.; Liu, Y.; Xing, X.
Funding acquisition: Tan, X.
Availability of data and materials
Data will be made available from the corresponding author upon reasonable request.
Financial support and sponsorship
Financial support was obtained from the National Natural Science Foundation of China (72140007), China Postdoctoral Science Foundation (2022M713221), and China Association for Science and Technology (20220615ZZ07110195).
Conflicts of interest
All authors declared that there are no conflicts of interest.
Ethical approval and consent to participate
Not applicable
Consent for publication
Not applicable.
Copyright
© The Author(s) 2025.
Supplementary Materials
REFERENCES
1. IEA. Net zero by 2050: a roadmap for the global energy sector. 2021. Available from: https://www.iea.org/reports/net-zero-by-2050 [Last accessed on 14 May 2025].
2. CPI. Global landscape of climate finance 2023. Available from: https://www.climatepolicyinitiative.org/wp-content/uploads/2023/11/Global-Landscape-of-Climate-Finance-2023.pdf [Last accessed on 14 May 2025].
3. IEA. Renewables 2023. 2024. Available from: https://www.iea.org/reports/renewables-2023 [Last accessed on 14 May 2025].
4. van den Bergh, J.; Castro, J.; Drews, S.; et al. Designing an effective climate-policy mix: accounting for instrument synergy. Clim. Policy. 2021, 21, 745-64.
5. Li, L.; Taeihagh, A. An in-depth analysis of the evolution of the policy mix for the sustainable energy transition in China from 1981 to 2020. Appl. Energy. 2020, 263, 114611.
6. Rayner, J.; Howlett, M.; Wellstead, A. Policy mixes and their alignment over time: patching and stretching in the oil sands reclamation regime in Alberta, Canada. Environ. Policy. Gov. 2017, 27, 472-83.
7. Lam, A.; Mercure, J. F. Which policy mixes are best for decarbonising passenger cars? Simulating interactions among taxes, subsidies and regulations for the United Kingdom, the United States, Japan, China, and India. Energy. Res. Social. Sci. 2021, 75, 101951.
8. Li, K.; Yan, Y.; Zhang, X. Carbon-abatement policies, investment preferences, and directed technological change: evidence from China. Technol. Forecast. Soc. Chang. 2021, 172, 121015.
9. Zhang, Z.; Zhang, A.; Wang, D.; Li, A.; Song, H. How to improve the performance of carbon tax in China?. J. Clean. Prod. 2017, 142, 2060-72.
10. Axsen, J.; Plötz, P.; Wolinetz, M. Crafting strong, integrated policy mixes for deep CO2 mitigation in road transport. Nat. Clim. Chang. 2020, 10, 809-18.
11. Bhardwaj, C.; Axsen, J.; Mccollum, D. Which “second-best” climate policies are best? Simulating cost-effective policy mixes for passenger vehicles. Resour. Energy. Econ. 2022, 70, 101319.
12. Savin, I.; Drews, S.; van den Bergh, J. Carbon pricing - perceived strengths, weaknesses and knowledge gaps according to a global expert survey. Environ. Res. Lett. 2024, 19, 024014.
13. UNFCCC. Summary and recommendations by the standing committee on Finance. 2022. Available from: https://unfccc.int/sites/default/files/resource/J0156_UNFCCC%20BA5%202022%20Summary_Web_AW.pdf [Last accessed on 14 May 2025].
14. Ellis, J.; Caruso, R.; Ockenden, S. Exploring climate finance effectiveness. In Climate Change Expert Group Paper No. 2013(4); OECD Publishing, 2013. Available from: https://www.oecd.org/content/dam/oecd/en/publications/reports/2013/10/exploring-climate-finance-effectiveness_g17a245b/5jzb44nmnbd2-en.pdf [Last accessed on 14 May 2025].
15. OECD. Climate finance provided and mobilised by developed countries: aggregate trends updated with 2019 data; OECD Publishing, 2021.
16. de Souza Cunha, F. A. F.; Meira, E.; Orsato, R. J.; Klotzle, M. C.; Lucena, A. F. P. Do low-carbon investments in emerging economies pay off? Evidence from the Brazilian stock market. Int. Rev. Financ. Anal. 2021, 74, 101700.
17. Goulder, L. H.; Long, X.; Qu, C.; Zhang, D. China’s nationwide Co2 emissions trading system: a general equilibrium assessment. National Bureau of Economic Research Publishing, 2023.
18. Mo, J.; Zhang, W.; Tu, Q.; et al. The role of national carbon pricing in phasing out China's coal power. iScience 2021, 24, 102655.
19. Xuan, D.; Ma, X.; Shang, Y. Can China’s policy of carbon emission trading promote carbon emission reduction?. J. Clean. Prod. 2020, 270, 122383.
20. Zeng, A.; Sheng, Y.; Gu, B.; Wang, Z.; Wang, M. The impact of climate aid on carbon emissions reduction and the role of renewable energy: evidence from the Belt and Road countries. Environ. Sci. Pollut. Res. Int. 2022, 29, 77401-17.
21. Peters, B. G.; Capano, G.; Howlett, M.; Mukherjee, I.; Chou, M. H.; Ravinet, P. Designing for policy effectiveness; Cambridge University Press, 2018.
22. Gunningham, N.; Grabosky, P.; Sinclair, D. Smart regulation: designing environmental policy; Clarendon Press, 1998.
23. Skjærseth, J. B. Towards a European green deal: the evolution of EU climate and energy policy mixes. Int. Environ. Agreements. 2021, 21, 25-41.
24. Chen, X.; Huang, P.; Xiao, Z. Uncovering the verticality and temporality of environmental policy mixes: the case of agricultural residue recycling in China. Rev. Policy. Res. 2022, 39, 632-53.
25. Ma, W.; de Jong, M.; de Bruijne, M.; Mu, R. Mix and match: configuring different types of policy instruments to develop successful low carbon cities in China. J. Clean. Prod. 2021, 282, 125399.
26. Pahle, M. Pricing carbon for a fair and effective low-carbon road transport transition in the EU. One. Earth. 2023, 6, 7-10.
27. Edmondson, D. L.; Kern, F.; Rogge, K. S. The co-evolution of policy mixes and socio-technical systems: towards a conceptual framework of policy mix feedback in sustainability transitions. Res. Policy. 2019, 48, 103555.
28. Sun, Y. T. Craft an innovative and synergic policy framework for enabling climate investment and financing. Environ. Prot. 2023, 51, 38-41.
29. Migo-Sumagang, M. V.; Tan, R. R.; Aviso, K. B. A multi-period model for optimizing negative emission technology portfolios with economic and carbon value discount rates. Energy 2023, 275, 127445.
30. Duan, H.; Yang, J. The evaluation of role of policy synergies in achieving China’s INDC targets. J. Environ. Econ. 2018, 3, 11-26.
31. Qiu, Y. Q.; Tsan Sheng Ng, A.; Zhou, P. Optimizing urban electric vehicle incentive policy mixes in China: perspective of residential preference heterogeneity. Appl. Energy. 2022, 313, 118794.
32. Wang, X.; Zou, H.; Zheng, Y.; Jiang, Z. How will different types of industry policies and their mixes affect the innovation performance of wind power enterprises? Based on dual perspectives of regional innovation environment and enterprise ownership. J. Environ. Manag. 2019, 251, 109586.
33. Gosens, J.; Kåberger, T.; Wang, Y. China's next renewable energy revolution: goals and mechanisms in the 13th Five Year Plan for energy. Energy. Sci. Eng. 2017, 5, 141-55.
34. Hood, C.; Margetts, H. The tools of government in the digital age; Bloomsbury Publishing, 2007. Available from: https://www.oii.ox.ac.uk/research/publications/the-tools-of-government-in-the-digital-age/ [Last accessed on 16 May 2025].
35. Thelen, K. Institutional change in advanced political economies. Brit. J. Ind. Relat. 2009, 47, 471-98.
37. Chang, K. Economic effect of renewable energy's subsidy policies based on the perspective of costs and benefits. J. Ind. Technol. Econ. 2015, 34, 98-105.
38. Lin, B.; Chen, Y. Impacts of policies on innovation in wind power technologies in China. Appl. Energy. 2019, 247, 682-91.
39. Zha, D.; Jiang, P.; Zhang, C.; Xia, D.; Cao, Y. Positive synergy or negative synergy: an assessment of the carbon emission reduction effect of renewable energy policy mixes on China's power sector. Energy. Policy. 2023, 183, 113782.
40. IRENA. Renewable power generation costs in 2022. 2023. Available from: https://www.irena.org/Publications/2023/Aug/Renewable-Power-Generation-Costs-in-2022 [Last accessed on 14 May 2025].
41. IRENA. Renewable power generation costs in 2020. 2021. Available from: https://www.irena.org/publications/2021/Jun/Renewable-Power-Costs-in-2020 [Last accessed on 14 May 2025].
42. Institute of Climate Change, and Sustainable Development of Tsinghua University. China's long-term low-carbon development strategies and pathways: comprehensive report; Springer Nature Publishing, 2022.
43. Kong, L.; Tan, X.; Gu, B.; Yan, H. Significance of achieving carbon neutrality by 2060 on China's energy transition pathway: a multi-model comparison analysis. Adv. Clim. Chang. Res. 2023, 14, 32-42.
44. NEA. New power system development blue book; China Electric Power Press, 2023. Available from: https://www.nea.gov.cn/download/xxdlxtfzlpsgk.pdf [Last accessed on 16 May 2025].
45. Savin, I.; King, L. C.; van den Bergh, J. Analysing content of Paris climate pledges with computational linguistics. Nat. Sustain. 2025, 8, 297-306.
Cite This Article
How to Cite
Download Citation
Export Citation File:
Type of Import
Tips on Downloading Citation
Citation Manager File Format
Type of Import
Direct Import: When the Direct Import option is selected (the default state), a dialogue box will give you the option to Save or Open the downloaded citation data. Choosing Open will either launch your citation manager or give you a choice of applications with which to use the metadata. The Save option saves the file locally for later use.
Indirect Import: When the Indirect Import option is selected, the metadata is displayed and may be copied and pasted as needed.
About This Article
Copyright

Data & Comments
Data
0


Comments
Comments must be written in English. Spam, offensive content, impersonation, and private information will not be permitted. If any comment is reported and identified as inappropriate content by OAE staff, the comment will be removed without notice. If you have any queries or need any help, please contact us at [email protected].