

Quantification and identification of microplastic in sediment and surface water from selected areas in the Brunei ecosystem
 0
0 Abstract
Microplastic pollution poses a significant threat to global environmental health, particularly within freshwater ecosystems, where these minute particles accumulate and persist. This research endeavors to provide a thorough examination of microplastic contamination within the Brunei River, aiming to elucidate its abundance, distribution patterns, and polymer composition. Sediment and water samples were systematically collected from six locations along the river, employing rigorous methodologies for microplastic isolation and characterization, including microscopy and Fourier-transform infrared spectroscopy (FTIR). The analysis revealed substantial microplastic abundance within both sediment and the water column, with concentrations averaging 1212 particles/g and 850 particles/L, respectively. Notably, transparent microplastics dominated sediment samples, constituting 28% of observed particles, while black microplastics prevailed in the water column, comprising 38% of the total. Through attenuated total reflectance-Fourier transform infrared spectroscopy (ATR-FTIR) analysis, six distinct polymer compositions were identified, encompassing mixed polymers, polyethylene terephthalate, polypropylene, polyamide, high-density polyethylene, and low-density polyethylene. Furthermore, spatial analysis demonstrated a significant correlation between microplastic contamination in sediment and water samples and the proximity to densely populated and urbanized areas along the riverbanks. This relationship highlights the substantial influence of anthropogenic activities on pollution levels within these ecosystems. These findings underscore the critical need for targeted interventions to address microplastic pollution in riverine environments. Implementing sustainable waste management practices and enforcing robust regulatory measures are essential steps to mitigate this growing environmental challenge and protect both ecological integrity and human health.

Keywords

INTRODUCTION
According to research by Geyer et al.[1] in 2017 and the OECD Global Plastics Outlook of 2022, global plastic production has skyrocketed since 1950 from 2 million tons to almost 460 million tons by 2019[2,3], largely driven by its affordability, versatility, and lightweight, as well as durability (i.e., water and thermal resistance). Plastic pollution has become one of the most pressing environmental challenges, with significant implications for ecosystems, biodiversity, and human health[4-7]. Microplastics, in particular, are persistently detected across all environmental matrices and threaten marine biodiversity[8-10]. The very properties that make plastics useful also contribute to their persistence in the environment, particularly in the form of microplastics (1 um-5 mm), which are either formed through the degradation of larger plastic items or intentionally manufactured at micro sizes[11,12]. Due to their small size and varied shapes, micro-sizes are easily ingested by marine organisms and can act as carriers or vectors for co-pollutants, thereby posing emerging risks to food security and human health[13-17]. Despite the emerging trends in microplastic research, there are still large knowledge gaps, especially in underrepresented regions and waterbodies such as Southeast Asia and South Asia riverine and river basins. For instance, rivers such as the Yangtze[18] and the Ganges[19] are reported to be the roadways that deliver millions of tons of land-based plastic waste to the oceans each year, whereby it was suggested that the highly urbanized and poorly managed regions contribute disproportionately to the microplastics pollutions. Nevertheless, with the widespread presence of microplastics in the water and sediments, tracing their sources and origins poses a significant challenge due to their small sizes and interactions with natural sediment particles.
One such region is the Sultanate of Brunei Darussalam, located on the island of Borneo. Here, rich biodiversity is reflected in pristine rainforests, various types of mangroves, and colorful coral reefs[20,21]. Brunei presents a unique opportunity for microplastic research due to its distinct geographic and social context. The Brunei River, a major waterway flowing through the country and its capital, Bandar Seri Begawan, before emptying into the South China Sea, is a critical point of focus. With numerous tributaries supporting diverse water-based activities, this relatively short river system acts as a significant potential entry point for microplastics in Brunei and Southeast Asia. Understanding microplastic distribution within the Brunei River requires an integrated approach that considers both local characteristics and natural processes.
To date, no published studies have comprehensively examined the presence, distribution, or impacts of microplastics in the ecosystem of Brunei rivers and sediments. Thus, it highlights the importance of this current research, which is the first comprehensive study of microplastic pollution in Brunei, combining detailed spatial distribution and microplastic’s physical and chemical analysis. Two main localities were sampled along the riverside adjacent to the Brunei River: Kampong Ayer and beaches along the northern coastline of Brunei Muara District. Major activities along these streams include residency, fishing, and tourist activities. To our knowledge, this is the first single research paper that examined the occurrence and spatial distribution of microplastics in Brunei’s environment and discussed potential impacts. This study fills this very important data gap and is the first investigation conducted on microplastic pollution in Brunei. This study also provides the first reported baseline on microplastic contamination within Brunei, focusing on rivers and beaches of the Brunei ecosystem, thus providing an initial step toward informing future research and target conservation and management strategies. This research has a large impact on Brunei itself, and it is known that it has important contributions to the general microplastic problem in the world. The results of this study are important not only to Brunei but also to provide new global knowledge on the extent and impact of microplastics as it is a widespread, yet understudied pollutant.
METHODOLOGY
Sampling location and protocol
Samples of water and sediments were taken at two main locations along the riverside of the Brunei River of Kampong Ayer located at the center of Brunei Muara district and beaches along the northern coastline of Brunei Muara District. Sampling locations from the Brunei River at Kampong Ayer were taken from locations such as Kiulap boat jetty, Eco Corridor, Kampong Saba, and Soto Pabo. Brunei River of Kampong Ayer was chosen to represent the urban area of the water stream at Bandar Seri Begawan, as shown in Figure 1. Major activities that are performed at these specific locations are linked to residency, fishing, and tourist activities. As for the seaside, samples were taken at the coastline of Pantai Tarindak and Pantai Berakas to represent the rural area of a water stream. Samples taken from beaches were used for comparison with the river area, where microplastic abundance was high. Sampling activities were performed between December 2023 and February 2024. The details of the sampling locations, along with their coordinates, are given in Tables 1 and 2.
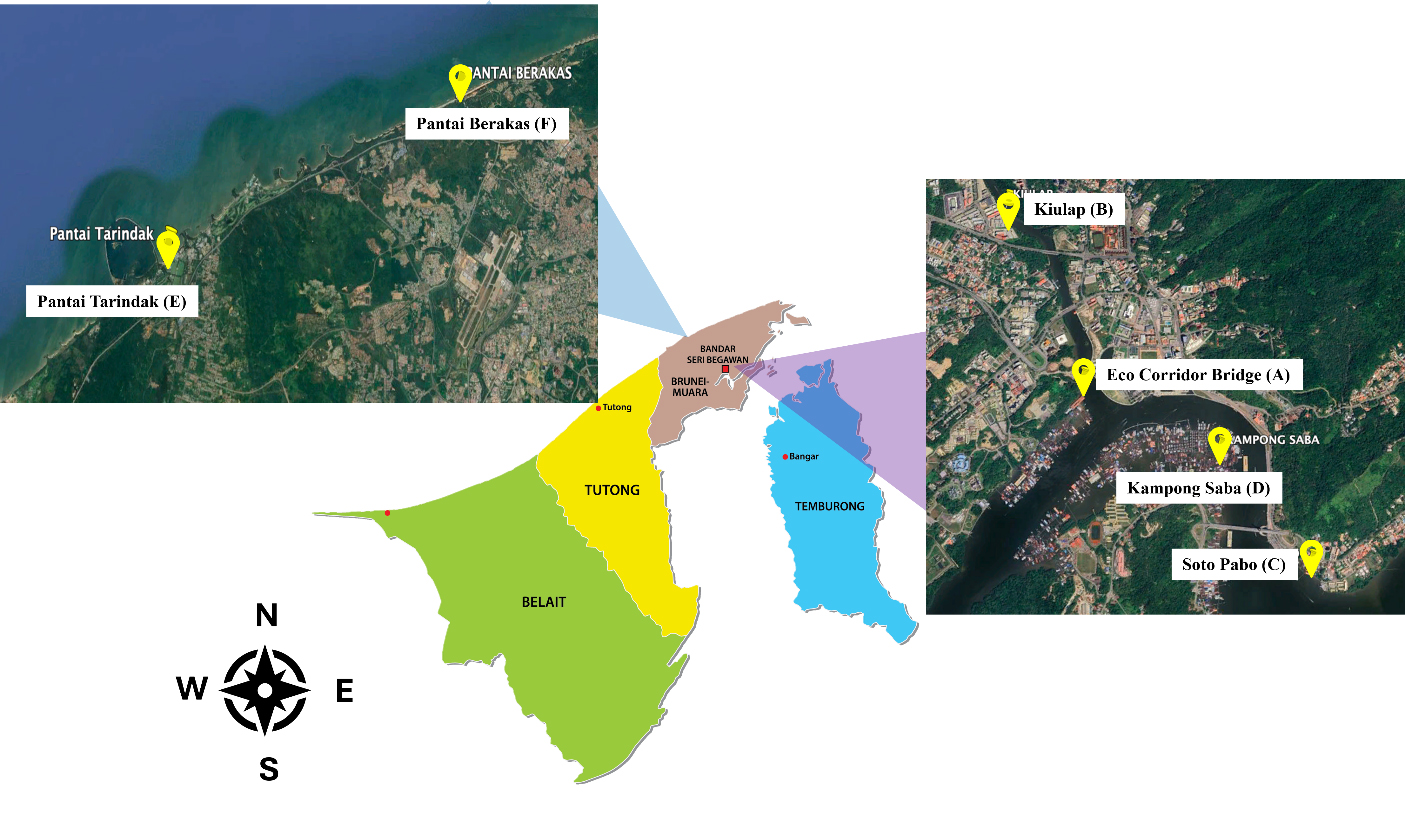
Geographic locations of sediment sampling sites, nearby population and names of surrounding areas
| Station | Sampling site | Type of sampling area | Coordinates (from Maps) |
| A | Eco Corridor Bridge | Semi-Rural | 4.888759°N, 114.93634°E |
| B | Kiulap | Urban | 4.90036°N, 114.93041°E |
| C | Soto Pabo | Urban | 4.522561°N, 114.571188°E |
| D | Kampong Saba | Urban | Detailed in Supplementary Figure 2 for not sampling |
| E | Pantai Tarindak | Rural | 4.94720°N, 114.82676°E |
| F | Pantai Berakas | Rural | 4.593526°N, 114.55684°E |
Geographic locations of water sampling sites, nearby population and names of surrounding areas
| Station | Sampling site | Type of sampling area | Coordinate (from Maps) |
| A | Eco Corridor Bridge | Semi-Rural | 4.88742°N, 114.93632°E |
| B | Kiulap | Urban | 4.90109°N, 114.93003°E |
| C | Soto Pabo | Urban | 4.522441°N, 114.571120°E |
| D | Kampong Saba | Urban | 4.525546°N, 114.564849°E |
| E | Pantai Tarindak | Rural | 4.564475°N, 114.493180°E |
| F | Pantai Berakas | Rural | 4.593819°N, 114.551003°E |
Sediment sampling
For the intertidal zones, sample collection began using a 1 m2 quadrant, with surface sediment scooped using a metal shovel, which served as the standardized sampling unit[22]. At each location, three 500 g subsamples were gathered at each location and stored in the new Ziplock plastic bags. This sample size was chosen to provide a representative sedimentary environment. To avoid overlapping influences and ensure that each sample represented a distinct portion of the intertidal ecosystem, the quadrats were spaced at least 100 meters apart.
Water sampling
The BabyLegs device was employed to collect water samples[23] [Supplementary Figure 1]. This compact device is designed to collect microplastics from aquatic settings, specifically from soil and river water samples. It consists of a cylindrical container with a collection chamber at one end and a mesh filter at the other. To retain microplastic particles, water must pass through the mesh filter while the device is submerged in the water sample. After isolation from the matrixes, the microplastics are gathered in the chamber for further examination, identification, and quantification[23-25]. The BabyLegs was half submerged at an angle and towed across the sampling area for a duration of 10-15 min. Typically, 2-3 samples were obtained from each site[26]. A fresh set of leggings was used for each subsample to maintain sample integrity. The mesh component of the BabyLegs device used in this study was made of 100% nylon with a 10-micron pore size, which effectively captured very fine microplastic particles. To minimize contamination, special care was taken to prevent synthetic fiber shedding from the mesh material, and all equipment was thoroughly rinsed with filtered distilled water before and after each sampling. Subsequently, the used leggings were placed in Ziplock bags for preservation and stored in a refrigerator at 4 °C until extraction and analysis could be performed[27].
EXTRACTION AND PURIFICATION FROM SAMPLES
Microplastic extraction from sediment Sample
The sediment samples underwent a drying process at 80 °C for a duration of 2 h or until completely dried. Subsequently, 100 g of the dried sediment was carefully sifted through a 500 μm sieve to remove larger particles[28]. The sifted samples were then transferred into a 500 mL beaker, and 200 mL of 5 M NaCl solution was added. The mixture was stirred at a rate of 600 rpm for a brief period and then allowed to settle for at least 1 hour to facilitate sedimentation. Next, a 1:1 mixture of 20 mL of H2O2 and Fenton reagent was introduced into the beaker[21]. The solution was heated to 85 °C while stirring at 600 rpm. Vigorous boiling occurred as a result of the oxidation process. If excessive boiling occurred, distilled water was added gradually, and the heat source was removed to prevent overflow. The beaker was then covered with aluminum foil and left undisturbed to settle for at least 24 h. Following this, 6 g of NaCl was added at a ratio of 1:20 relative to the sample volume. The mixture was briefly stirred and left to settle for at least 60 min to allow a clear supernatant to form. The supernatant was then filtered under vacuum using Whatman filter paper (11 µm pore size), leaving the settled sediment in the beaker. The filtered material was transferred onto an aluminum tin cup and dried completely.
Microplastic extraction from water Samples
The leggings were thoroughly rinsed with clean water, starting from the top and directing the flow downward to wash any plastic particles toward the bottom. The lower portion of the leggings was then rinsed with distilled water, and the runoff was collected in a clean 500 mL beaker. For water samples containing organic matter, such as leaves or wood, a mixture of H2O2 and Fenton reagent (1:1 ratio) was added to the beaker[2,29,30]. The solution was then left to oxidize for at least 24 hours to break down the organic material. In samples without organic matter, vacuum filtration was performed using Schleicher & Schuell Filter Paper (Ø55 mm, pore size: 4 μm). A 500 µm sieve was placed above the filter paper to retain larger particles or plastic fragments. The sieves were gently rinsed with distilled water. Finally, the filtered material was transferred onto an aluminum tin cup and left to dry completely.
Sample storage and precautions
To minimize the risk of plastic contamination, all samples were transferred to pre-cleaned glass containers wrapped in aluminum foil. These containers were rinsed thoroughly with Milli-Q water before use. Although samples were initially stored in Ziplock bags, this practice was later replaced with the glass-aluminum protocol, which is recommended for all future sampling and analyses.
Sample collection
At each of the six sampling sites, triplicate samples of both surface water and sediment were collected to ensure representativeness and minimize spatial bias. Water samples (1 liter each) were collected just below the surface using pre-cleaned stainless steel containers and then immediately transferred to glass bottles wrapped in aluminum foil. For sediment, triplicate grab samples were collected using a stainless steel scoop from the top 10 cm of the sediment layer within a 1-meter radius and pooled for individual analysis. All samples were kept chilled and processed within 24 h of collection.
IDENTIFICATION AND CHARACTERIZATION OF EXTRACTED MICROPLASTICS
Identification of microplastics in water and sediment samples
Microplastic particles isolated from water and sediment samples were analyzed using ATR-FTIR (QATR-S FTIR Shimadzu Spectrometer, Shimadzu Corp). Spectral data were acquired over the range of 4000-500 cm-1 at a resolution of 4 cm-1. Each sample was scanned 32 times to ensure an adequate signal-to-noise ratio. Background spectra were recorded before each measurement and subtracted from the sample spectra to eliminate environmental interference. Polymer types were identified by comparing the obtained spectra with a reference spectral library, using a match threshold of ≥ 70%.
Precaution methodology
All laboratory equipment and glassware were initially subjected to a thorough cleaning procedure, which involved rinsing twice with filtered distilled water. After rinsing, the items were carefully left to air dry inside a designated fume hood, allowing any residual moisture to evaporate naturally at room temperature. To shield against any external contaminants such as dust and airborne particles, each piece of equipment and glassware was promptly covered with aluminum foil once dry. Considering the potential release of fibers from clothing[31], particularly during sample handling, additional precautions were taken. For example, cotton lab coats and gloves were consistently worn throughout the analytical process. The sieve, an essential tool for the sampling procedures, was also meticulously covered to prevent contamination from airborne fibers that might compromise sample integrity[12]. To further maintain sample purity and minimize the risk of cross-contamination, strict handling protocols were followed for all glass containers and other materials used in the analysis. After each step, items were securely covered, and any surfaces that came into contact with the samples were carefully cleaned using filtered water. Following the filtration process, the collected samples were immediately wrapped in aluminum foil to prevent any external contaminants. For the subsequent stereomicroscopic analysis, additional measures were taken to ensure sample purity[32]. Before accessing and analyzing the Petri dishes containing microplastic particles, the workspace was thoroughly cleaned to eliminate potential sources of contamination. As shown in Supplementary Figure 6, the FTIR analysis of the blank control sample confirmed that no external spectral interference occurred during the study.
RESULTS AND DISCUSSION
A comprehensive analysis of various sampling sites revealed notable patterns in the prevalence of microplastics based on their shapes and colors in both sediment and water samples. The distribution of microplastics collected from each station is presented in Figure 2A-D. For sediment samples, the distribution patterns were categorized by both color and shape, as illustrated in Figure 3A and B. Among all sites, Station A exhibited the highest concentration of microplastics, with an average count of 130 particles (Abundance: 2.95/g), while Station E recorded the lowest, averaging 67 particles (Abundance: 2.07/g), as shown in Figure 2A. This disparity could be attributed to the location of Station A in a commercial area where illegal littering is rampant, as evidenced in Supplementary Figure 2. In contrast, Station E, which is situated closer to the beach, may experience lower microplastic accumulation due to wave action that can wash sediment-bound microplastics back into the water[8]. The distribution of microplastic shapes in sediment sampling revealed a consistent trend across all stations: fragment-shaped microplastics were the most prevalent, while fibers were the least common. This indicates that fragmentation is a significant source of microplastic pollution in the ecosystem. Additionally, a significant presence of pellets was also observed, which may represent primary microplastics originating from industrial sources or cosmetic products.
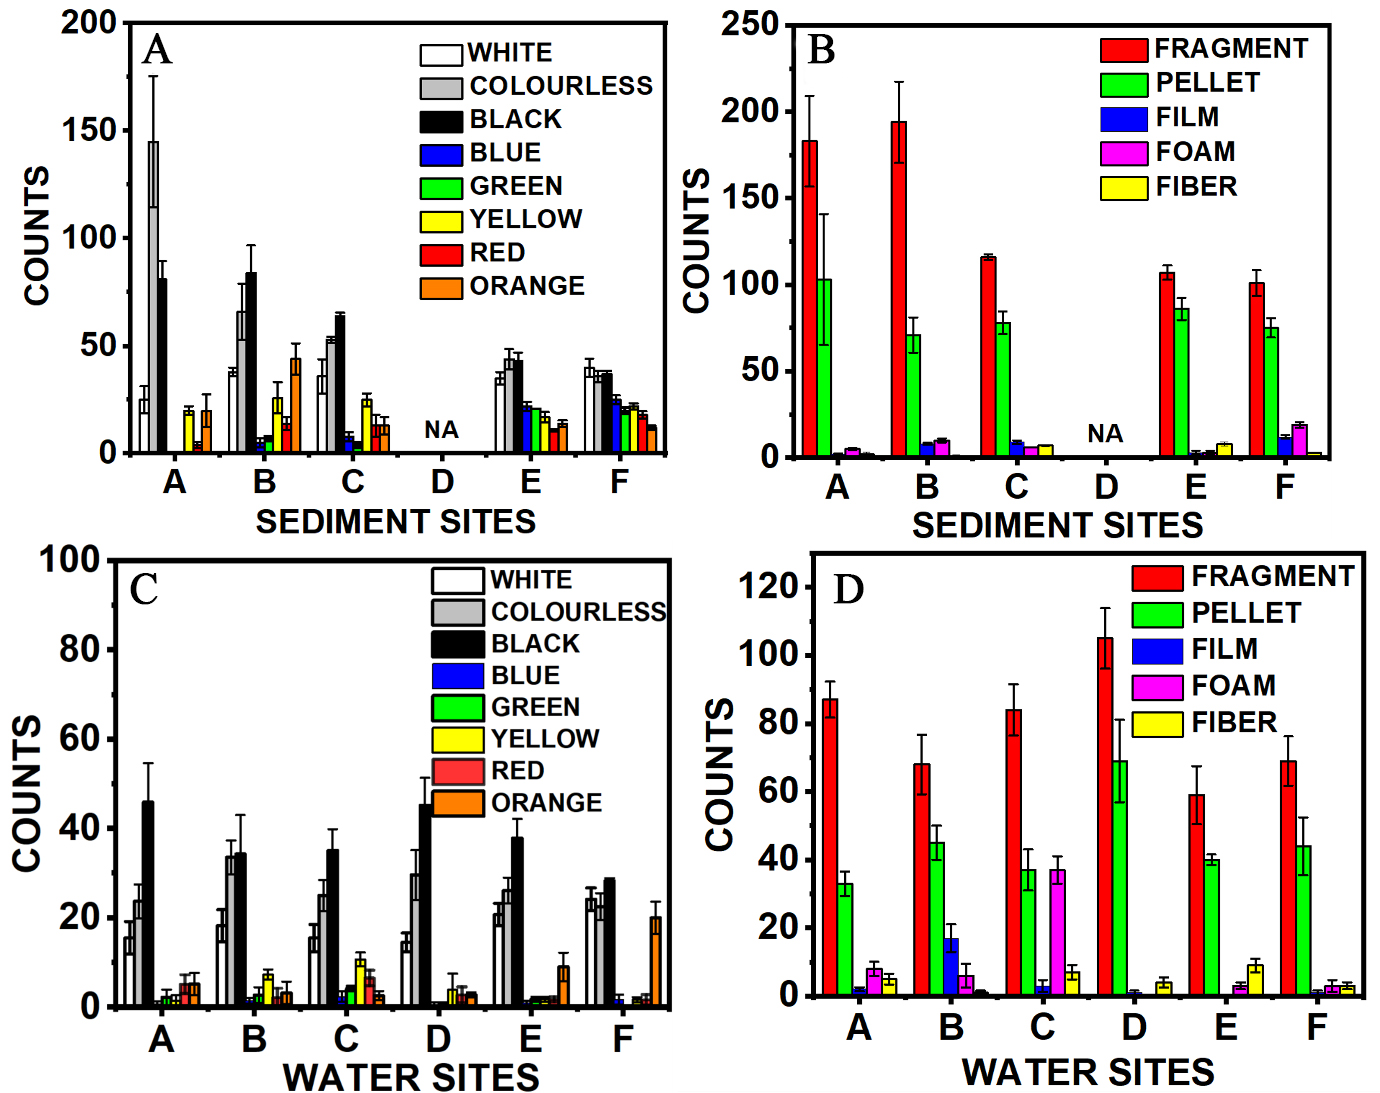
Figure 2. Distribution of MP by color and shape. (A and B) Sediment sampling sites and (C and D) water sampling sites. Detailed counts are provided in Supplementary Figure 3, Table 1. MP: microplastic.
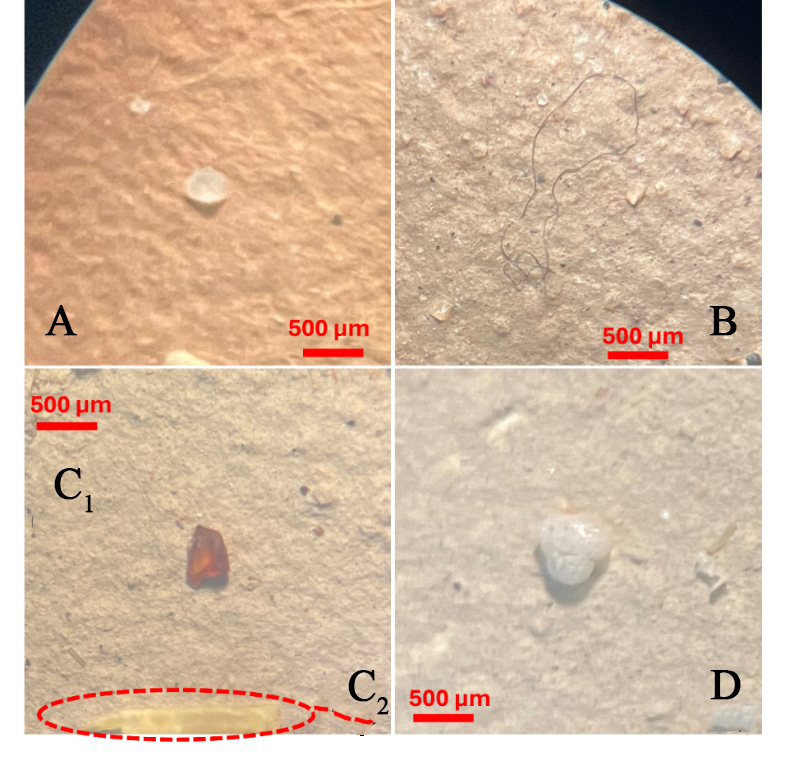
Figure 3. Microscopic images of collected microplastic (10/20X Magnification), classified by shape: (A) Pellet; (b) Fiber; (C1) Fragment; (C2) Film; (D) Foam.
In surface water samples, microplastic distribution patterns were similarly analyzed by color and shape, as shown in Figure 2C and D. An interesting trend was noted: despite variations in total microplastic abundance, the particle counts remained relatively consistent across different sites. Specifically, Stations A and B each reported counts of 132 ± 4 particles (Abundance: 0.27 particles/L), both being located in densely populated and commercially active areas. In contrast, Stations E and F, which fringe the open sea and experience minimal human activity, recorded the lowest counts, averaging 110 ± 7 particles (Abundance: 0.22 particles/L).
The observed pattern in water samples likely reflects the same factors discussed for sediment samples. Sites A and B, with greater human activity, tend to accumulate more microplastics, whereas at Sites E and F, wave action may disperse or remove microplastics, as shown in Figure 2C. Similarly, shape analysis of the water samples revealed that fragments were the most abundant form of microplastics, while fibers were again the least common, as shown in Figure 2D. Overall, the similarities in color and shape distributions across sites suggest a common origin for much of the microplastic pollution - likely stemming from human littering. Further details on the color and shape distributions for all stations, in both sediment and water samples, are given in the Supplementary Figures 3 and 4.
Figure 3A-D presents samples of each microplastic shape, categorized as (A) pellets; (B) fibers; (C1) fragments; (C2) films; and (D) foam, captured using an optical microscope at 10-20X magnification. Microplastics of similar colors were observed across various size scales, suggesting that larger particles may break down into smaller ones. This supports the idea that, under harsh environmental conditions, the degradation of microplastics can eventually lead to the formation of nanoplastics.
To investigate the potential polymer types associated with the collected microplastics, a total of 50 large-sized microplastics were randomly selected for functional group analysis using ATR-FTIR. The polymers were identified based on their matching indices with a reference polymer library and by comparison with previous studies (e.g., Jung et al.[33]). The analysis revealed that the predominant polymer types included polyamide (PA)/modified PA, Low-Density polyethylene (LDPE), polyethylene terephthalate (PET) polypropylene (PP), High-Density Polyethylene (HDPE), and Mixed polymer (MX), as shown in Figure 4A-F and summarized in Figure 5. Some of the analyzed particles were found to be non-plastic materials and were therefore excluded from the results[34].
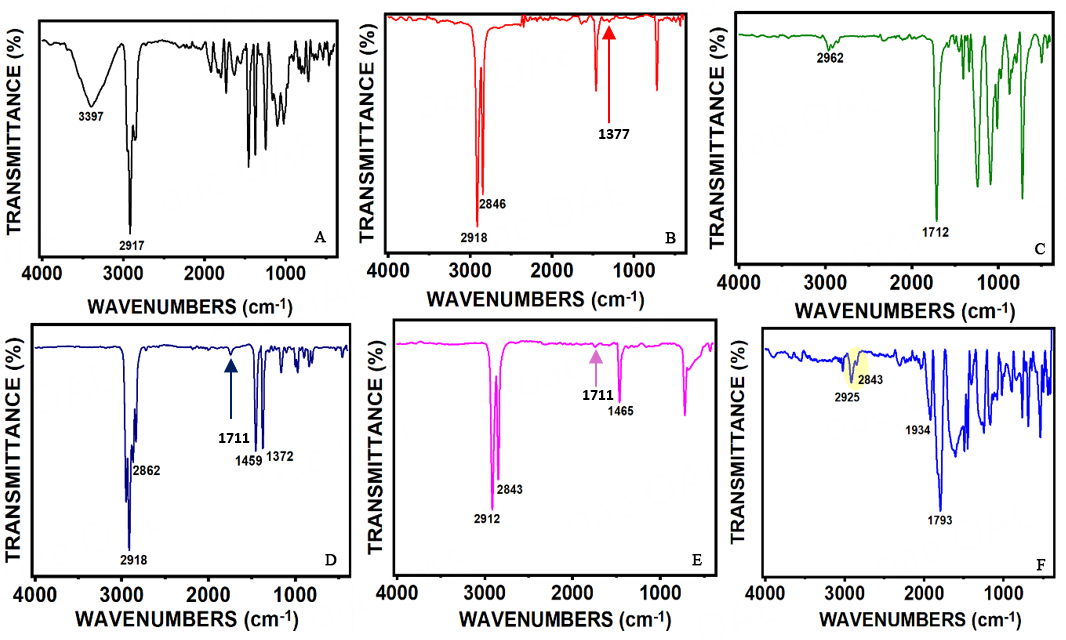
Figure 4. FTIR analysis of MP samples: (A) PA/modified; (B) LDPE; (C) PET; (D) PP; (E) HDPE; (F) Mixed polymer with excess ester stretching. PA: polyamide; FTIR: Fourier-transform infrared spectroscopy; MP: microplastic; LDPE: low-density polyethylene; PET: polyethylene terephthalate; PP: polypropylene; HDPE: high-density polyethylene.
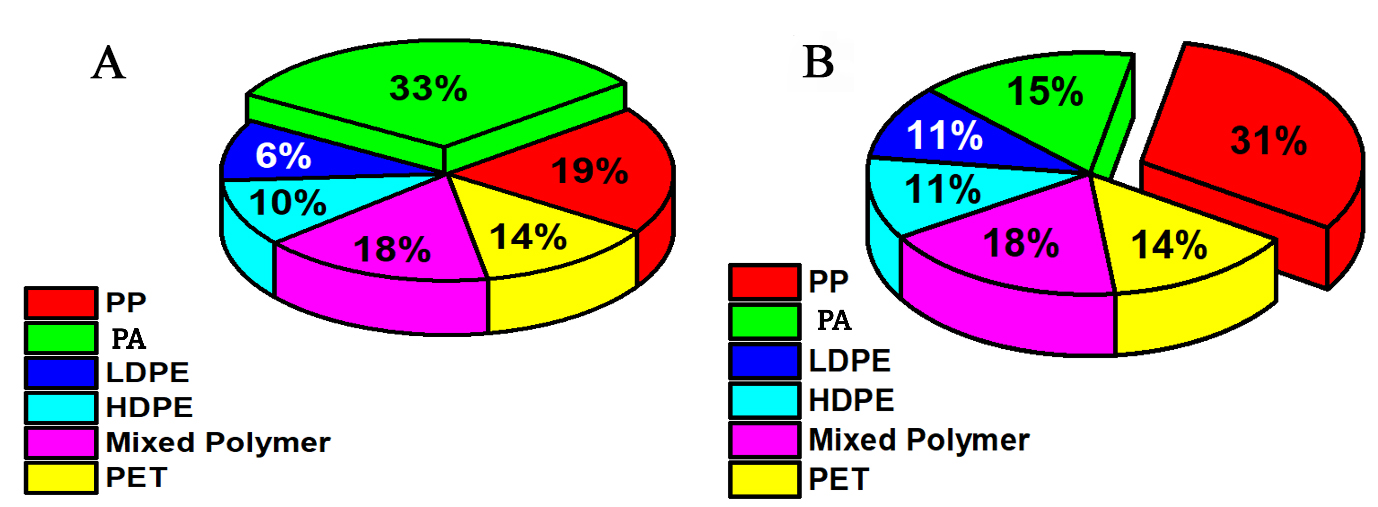
Figure 5. Overall distribution of identified polymers from (A) sediment sampling sites and (B) water sampling sites.PP: polypropylene; PA: polyamide; LDPE: low-density polyethylene; PET: polyethylene terephthalate;HDPE: high-density polyethylene.
For polyamide materials, the absorption bands at 1650 cm-1 and 1550 cm-1 correspond to C=O stretching and NH bending, respectively. Notably, a strong NH- stretching band at 3397 cm-1 confirms the presence of polyamide, as shown in Figure 4A. However, the peaks observed in the fingerprint regions suggest that the sample may be a modified form of PA[35,36]. In the case of polypropylene, three characteristic peaks were identified: ν = 2840-2953 cm-1 (CH stretching), ν = 1457 cm-1 (CH2 bending), and ν = 1357 cm-1 (CH3 bending). Comparable FTIR spectra recorded by[32,37] show similar stretching and bending vibrations at ν = 2860-2960 cm-1, ν = 1452 cm-1, and ν = 1375 cm-1, demonstrating consistency with the current study. For PET[38], six prominent peaks were identified: a very weak peak at ν=3445 cm-1, and others at ν = 2856-2964 cm-1, ν = 1714 cm-1, ν = 1241 cm-1, ν = 1090 cm-1, and ν = 722 cm-1. The hydroxyl group band typically appears in the range of ν = 3400-3200 cm-1. PET likely originates from the breakdown of mismanaged plastic bottles and the manual washing of synthetic fabrics. For polyethylene (PE), including both LDPE and HDPE, three major characteristic peaks were observed: ν = 2848-2915-2843 cm-1 (CH stretching), ν = 1465-1464 cm-1 (CH2 bending), and ν = 721-719 cm-1 (CH2 rocking). An additional peak at ν = 1377 cm-1 was identified, which may help differentiate between the two types of PE. Weak wagging and out-of-plane twisting deformations of the -H-C-H linkage were detected at ν = 1299 cm-1 and 1041 cm-1, consistent with previously reported assignments[39]. Moreover, a very strong peak at ν = 847 cm-1 corresponds to the rocking deformation of the ethylene linkage. The presence of a peak around ν = 1711 cm-1 in HDPE and PP samples indicates oxidized materials[40]. Veerasingam et al.[41] suggested that the peak at ν = 1715 cm-1 is linked to the presence of ketone groups. It was believed to occur due to thermal oxidation, solar radiation, or biological processes, and can be attributed to weathering and environmental exposure. Another indicator of aged plastic is the presence of hydroxyl group functionalities (3400-3200 cm-1), although such peaks were not observed in this study. Previous studies have suggested that data loss may occur due to sample processing and treatment during the wet peroxidation procedure[42].
Polyolefins (including PP and PE) are commonly used materials in fishing due to their high resistance to abrasion. Given that fishing is one of the main sources of revenue for residents in the area, the presence of these materials is unsurprising. LDPE and HDPE[43] mainly arise from plastic waste such as wrappers and food containers. For mixed polymer materials, a strong absorption band corresponding to C=O carbonyl stretching was observed at 1793 cm-1. Aromatic stretching was observed at ν = 1637 cm-1, accompanied by additional weaker bands around ν = 1525 cm-1 and ν = 1408 cm-1. Aromatic C-H stretching vibrations were recorded, along with strong out-of-plane bending peaks at ν = 746-910 cm-1. Medium intensity absorptions observed at ν = 1934 cm-1, followed by peaks at 1400-1000 cm-1, suggest the possible overlap of functional groups such as C-F, C-N, and C-H, potentially associated with mixtures of polymer materials and additives[33].
In a comprehensive analysis, 50 randomly selected microplastic samples from each site were examined to determine their main polymer composition using ATR-FTIR. This spectroscopic technique was applied to both sediment and water samples, revealing a tapestry of polymer types pervading the environment, as FTIR is regarded as the most commonly used analytical method for identifying polymers in marine debris and microplastics[42]. Among the sediment samples, polystyrene was the predominant polymer, accounting for 33% of all total polymers detected, indicating its substantial contribution and persistence in the sedimentary environment. In contrast, low-density polyethylene was the least abundant, comprising only 6%, possibly due to differences in usage patterns or a lower tendency to settle in sediment layers, as shown in Figure 5A.
Microplastics identified in water samples exhibited a distinct polymer profile compared to those found in sediment. The investigation revealed a substantial abundance of microplastics, with sediments harboring an average of 1212 particles/g, whereas the water column contained approximately 850 particles/L. Notably, polypropylene was the most prevalent polymer, accounting for 31% of the detected polymers - possibly reflecting its widespread use in disposable products such as containers and cups, which frequently enter aquatic systems through improper disposal[44]. On the other end of the spectrum, both LDPE and HDPE were identified at equal levels, each comprising 11% of the polymer content in water samples, as shown in Figure 5B. Each type of microplastic exhibits a unique infrared spectrum corresponding to the main polymeric structure used in its manufacture. This allows FTIR to identify functional groups through peak analysis and determine the polymer type. However, the diverse types of microplastics and the significant overlap in their infrared absorption spectra complicate qualitative and quantitative analysis[45], especially for environmental samples that often contain mixtures of different microplastic types or polymer blends [Figure 4F], accounted for 18% of total samples across both matrices. Additionally, many plastics share common functional groups (e.g., C-H, C=O, and C=C bonds), resulting in overlapping peaks in their IR spectra[34]. The overlaid or complete polymer spectra are presented in Supplementary Figure 5 to provide an overview of the polymer composition.
This complex polymer distribution highlights the diverse origins and behaviors of various plastics in the environment. Interestingly, despite the common use of polyvinyl chloride in residential plumbing[46], it was not detected in any of the samples analyzed using ATR-FTIR. This unexpected absence may warrant further investigation into the environmental pathways and degradation processes of Polyvinyl chloride (PVC), or it may simply reflect the variability in polymer presence across different areas and environmental compartments[47].
MP CONCENTRATION VS. POLLUTION SOURCES
Relationship between MP concentration and types of pollution
The microplastic concentrations reported in this study - particularly at sites near wastewater outlets and densely populated areas - are notably high. When compared with similar studies, our findings align with the upper range of concentrations observed in contaminated urban waterways. Potential sources of MPs, such as urban runoff, industrial discharges, agricultural activities, and poor waste management, significantly influence their spatial distribution and concentration in the Brunei region. For instance, Eriksen et al.[37] reported MP concentrations ranging from 43,000 MPkm2 (downstream) to 466,000 MP/km2 in the Laurentian Great Lakes of the United States. These studies were conducted in densely populated spots, supporting the observation that MP abundance tends to increase with population density. Such elevated concentrations reflect localized anthropogenic stressors and are consistent with patterns observed in other studies examining riverine or estuarine systems impacted by urban runoff, informal settlements, and industrial activity. However, variations in sampling protocols, detection limits, and particle size thresholds among studies may also account for differences in reported concentrations and should be considered when making direct comparisons.
We find a strong, positive correlation between higher MP concentrations and proximity to urban areas, leading us to conclude that anthropogenic activity is likely the main contributor. Specifically, MPs derived from single-use plastics, food packaging, and synthetic fibers were more prevalent in predominantly residential neighborhoods, while industrial areas showed a higher abundance of MPs associated with specific polymers, such as PET, PA, and PP, in addition to Polyethylene (LD/HD-PE), as shown in the Figure 4A-F[48].
Sediment and water sampling: influence of the Brunei ecosystem
Sediment and water samples collected from various locations across the Brunei region revealed significant variations in MP concentrations. A strong correlation was observed between the shapes of microplastics found in sediment (58%) and water (56%) samples. Fragments were the most prevalent, as detailed in Supplementary Figure 4. Fibrous microplastics in sediment (2%) and film microplastics in water (3%) were the least common. These patterns suggest diverse pollution sources, including food packaging, fishing ropes, synthetic textiles, industrial components, and domestic appliances[41]. The findings highlight an urgent need for Brunei to improve waste management and public awareness to prevent plastic tsunami[3], which could disrupt the food chain. If left unaddressed, this issue may lead to widespread unintentional consumption of plastics - an emerging phenomenon referred to as “Plasticterian” behavior[49].
CHALLENGES AND LIMITATIONS, AND FUTURE RESEARCH DIRECTIONS
Research on microplastics faces several challenges and limitations, particularly the lack of standard methods. Currently, there is no one-size-fits-all way for studying and analyzing microplastics. As a result, findings from different studies are often difficult to compare, hindering comprehensive data interpretation and the development of effective solutions. Due to variations in resources and technical capacities, researchers often employ different sampling procedures and analytical techniques, which typically reflect local interests rather than global concerns[28,50]. Moreover, the instruments and techniques used to gather microplastic data might not be optimized for identifying smaller particles or for handling complex environmental matrices. This can lead to significant inaccuracies, including the potential undercounting or overcounting of microplastic particles during analysis[23]. To address these limitations, advanced methods such as chemical imaging combined with FTIR spectroscopy (e.g., micro-FTIR, LDIR, FPA-FTIR), thermal analysis [e.g., pyrolysis- Gas Chromatography-Mass Spectrometry (GC/MS) , Thermal Desorption-Gas Chromatography-Mass Spectrometry (TD-GC/MS), Thermogravimetric Analysis, and DSC stands for Differential Scanning Calorimetry (TGA-DSC)], and less commonly used approaches such as size exclusion chromatography (SEC) and evolved gas analysis-mass spectrometry (EGA-MS) can be employed. These techniques offer improved resolution and sensitivity, enabling more detailed analysis of environmental microplastics[48,51-53].
While ATR-FTIR spectroscopy enabled the reliable identification of most microplastic particles in this study, it has certain limitations, particularly in detecting smaller particles (< 20 µm) or pigmented samples where spectral absorption may be weak or obscured. To enhance identification accuracy, incorporating complementary techniques - especially Raman spectroscopy - is recommended, as it offers higher spatial resolution and is more effective for analyzing small or colored particles. Although Raman analysis was not feasible in the present study due to equipment constraints, future investigations should consider integrating both ATR-FTIR and Raman spectroscopy to achieve more comprehensive and accurate chemical characterization of microplastics[54].
Further research is required to more accurately quantify the contributions of different pollution sources. Techniques such as stable isotope analysis and advanced spectroscopic methods can improve source attribution by identifying distinctive signatures associated with specific types of plastics. When combined with hydrodynamic modeling, these approaches can provide predictive insights into MP dispersal patterns under varying environmental conditions, offering a more comprehensive framework for addressing MP pollution[55].
One of the main limitations of the current methodology is the use of saturated NaCl solution for density separation. Although effective for isolating low-density polymers such as PE and PP, this approach may fail to recover heavier microplastics like PVC, PET, and certain additives-laden plastics. Future studies should consider employing higher-density floatation media, such as zinc chloride (ZnCl2) or sodium iodide (NaI) solutions (density >1.5 g/cm3), to achieve a more comprehensive recovery across the full spectrum of plastic types[56]. However, the environmental, safety, and cost implications of these solutions should be carefully evaluated.
Here, we present an unprecedented study evaluating microplastic pollution within the particular context of the Brunei ecosystem. With its mangrove-rich coastlines, diverse marine fauna, and relatively undisrupted natural environments, Brunei offers an exceptional opportunity to research microplastic dynamics in a non-mainstream ecosystem. This research provides new insights into the sources, dispersion dynamics, and environmental consequences of microplastics across Brunei ecosystems. This includes mapping pollution hotspots, studying the impacts on native creatures, and assessing possible risks to traditional fishing practices and seafood safety. Furthermore, this research is conducted in collaboration with relevant local stakeholders - including academic institutions, Non-Governmental Organizations (NGOs), and government bodies in Brunei - providing a more comprehensive view of the social aspects of microplastic pollution. These partnerships also support the development of effective management strategies for vulnerable areas. Ultimately, this study aims to serve as a model for future investigations in similar ecosystems, highlighting its innovative contribution to the global understanding of microplastic pollution.
CONCLUSIONS
This study provides the first comprehensive assessment of microplastic (MP) pollution in the Brunei River ecosystem, revealing substantial concentrations in both sediment (average: 1212 particles/g) and surface water (average: 850 particles/L). Fragment-type MPs dominated in both environments, with transparent and black particles being the most common. ATR-FTIR analysis identified a diverse range of polymers, particularly polyamide and polypropylene, indicating diverse pollution sources linked to urban and coastal activities. The spatial distribution patterns underscore the significant impact of anthropogenic factors, especially near densely populated areas.
These findings not only offer a crucial baseline for understanding MP pollution in Brunei but also contribute to the broader understanding of MP dynamics in underrepresented tropical ecosystems. Future research should prioritize long-term monitoring, higher-resolution identification techniques (e.g., Raman spectroscopy), and source-tracing approaches to refine risk assessments and mitigation strategies. Strengthening public awareness and waste management policies will be key to curbing plastic pollution and safeguarding aquatic ecosystems and food security in the region.
DECLARATIONS
Authors’ contributions
Leading the research methodology: Chinglenthoiba, C.
Analyzing Data: Chinglenthoiba, C.
Sampling: Danish, H. R.
Following the research protocol: Danish, H. R.
Supervising the research: Anuar, S. T.; Santos, J. H.
Writing the first draft: Danish, H. R.
Further characterization: Danish, H. R.
Editing the draft: Anuar, S. T.; Santos, J. H.
Developing the project and research protocol for studying MP in Brunei: Chinglenthoiba, C.
Finalizing the manuscript: Chinglenthoiba, C.
Evaluating the manuscript: Anuar, S. T.; Santos, J. H.
Revising the manuscript: Anuar, S. T.; Santos, J. H.
Availability of data and materials
The data supporting the findings of this study are available within this Article and its Supplementary Materials. The datasets generated and/or analyzed during the current study are available from the corresponding authors upon reasonable request.
Financial support and sponsorship
Not applicable.
Conflicts of interest
All authors declared that there are no conflicts of interest.
Ethical approval and consent to participate
Not applicable.
Consent for publication
Not applicable.
Copyright
© The Author(s) 2025.
Supplementary Materials
REFERENCES
1. Geyer, R.; Jambeck, J. R.; Law, K. L. Production, use, and fate of all plastics ever made. Sci. Adv. 2017, 3, e1700782.
2. Tiwari, M.; Rathod, T. D.; Ajmal, P. Y.; Bhangare, R. C.; Sahu, S. K. Distribution and characterization of microplastics in beach sand from three different Indian coastal environments. Mar. Pollut. Bull. 2019, 140, 262-73.
3. Geyer, R.; Kuczenski, B.; Zink, T.; Henderson, A. Common misconceptions about recycling. J. Ind. Ecol. 2016, 20, 1010-7.
4. Wright, S. L.; Kelly, F. J. Plastic and human health: a micro issue? Environ. Sci. Technol. 2017, 51, 6634-47.
5. Cole, M.; Lindeque, P.; Halsband, C.; Galloway, T. S. Microplastics as contaminants in the marine environment: a review. Mar. Pollut. Bull. 2011, 62, 2588-97.
6. Mattsson, K.; Jocic, S.; Doverbratt, I.; Hansson, L. In Microplastic contamination in aquatic environments, 1st ed; .Nanoplastics in the Aquatic Environment; Elsevier, 2018; pp. 379-99.
7. Lee, W. S.; Cho, H. J.; Kim, E.; et al. Bioaccumulation of polystyrene nanoplastics and their effect on the toxicity of Au ions in zebrafish embryos. Nanoscale 2019, 11, 3173-85.
8. Kumar, A. S.; Varghese, G. K. Microplastic pollution of Calicut beach - contributing factors and possible impacts. Mar. Pollut. Bull. 2021, 169, 112492.
9. Daniel, D. B.; Ashraf, P. M.; Thomas, S. N. Abundance, characteristics and seasonal variation of microplastics in Indian white shrimps (Fenneropenaeus indicus) from coastal waters off Cochin, Kerala, India. Sci. Total. Environ. 2020, 737, 139839.
10. Kieu-Le, T. C.; Thuong, Q. T.; Truong, T. N.; Le, T. M.; Tran, Q. V.; Strady, E. Baseline concentration of microplastics in surface water and sediment of the northern branches of the Mekong River Delta, Vietnam. Mar. Pollut. Bull. 2023, 187, 114605.
11. Malankowska, M.; Echaide-gorriz, C.; Coronas, J. Microplastics in marine environment: a review on sources, classification, and potential remediation by membrane technology. Environ. Sci. :. Water. Res. Technol. 2021, 7, 243-58.
12. Chinglenthoiba, C.; Amesho, K. T. T.; Reddy, D. G. C. V.; Chellappan, S.; Lani, M. N. Microplastic as an emerging environmental threat: a critical review on sampling and identification techniques focusing on aquatic ecosystem. J. Polym. Environ. 2023, 31, 1725-47.
13. Gong, J.; Xie, P. Research progress in sources, analytical methods, eco-environmental effects, and control measures of microplastics. Chemosphere 2020, 254, 126790.
14. Wang, W.; Ndungu, A. W.; Li, Z.; Wang, J. Microplastics pollution in inland freshwaters of China: a case study in urban surface waters of Wuhan, China. Sci. Total. Environ. 2017, 575, 1369-74.
15. Karwacka, A.; Zamkowska, D.; Radwan, M.; Jurewicz, J. Exposure to modern, widespread environmental endocrine disrupting chemicals and their effect on the reproductive potential of women: an overview of current epidemiological evidence. Hum. Fertil. (Camb). 2019, 22, 2-25.
16. Jin, Y.; Lu, L.; Tu, W.; Luo, T.; Fu, Z. Impacts of polystyrene microplastic on the gut barrier, microbiota and metabolism of mice. Sci. Total. Environ. 2019, 649, 308-17.
17. Lehner, R.; Weder, C.; Petri-Fink, A.; Rothen-Rutishauser, B. Emergence of nanoplastic in the environment and possible impact on human health. Environ. Sci. Technol. 2019, 53, 1748-65.
18. Li, Y.; Lu, Z.; Zheng, H.; Wang, J.; Chen, C. Microplastics in surface water and sediments of Chongming Island in the Yangtze Estuary, China. Environ. Sci. Eur. 2020, 32, 297.
19. Pandey, D.; Singh, A.; Ramanathan, A.; Kumar, M. The combined exposure of microplastics and toxic contaminants in the floodplains of north India: A review. J. Environ. Manage. 2021, 279, 111557.
20. Aliabad, M. K.; Nassiri, M.; Kor, K. Microplastics in the surface seawaters of Chabahar Bay, Gulf of Oman (Makran Coasts). Mar. Pollut. Bull. 2019, 143, 125-33.
21. Uddin, S.; Fowler, S. W.; Behbehani, M. An assessment of microplastic inputs into the aquatic environment from wastewater streams. Mar. Pollut. Bull. 2020, 160, 111538.
22. Zaki, M. R. M.; Ying, P. X.; Zainuddin, A. H.; Razak, M. R.; Aris, A. Z. Occurrence, abundance, and distribution of microplastics pollution: an evidence in surface tropical water of Klang River estuary, Malaysia. Environ. Geochem. Health. 2021, 43, 3733-48.
23. National Oceanic and Atmospheric Administration (NOAA). Laboratory methods for the analysis of microplastics in the marine environment: recommendations for quantifying synthetic particles in waters and sediments; 2015. Available from: https://repository.library.noaa.gov/view/noaa/10296 (accessed 25 Apr 2025).
24. Zobkov, M. B.; Esiukova, E. E. Microplastics in a marine environment: review of methods for sampling, processing, and analyzing microplastics in water, bottom sediments, and coastal deposits. Oceanology 2018, 58, 137-43.
25. Catarino, A. I.; Thompson, R.; Sanderson, W.; Henry, T. B. Development and optimization of a standard method for extraction of microplastics in mussels by enzyme digestion of soft tissues. Environ. Toxicol. Chem. 2017, 36, 947-51.
26. Deocaris, C. C.; Allosada, J. O.; Ardiente, L. T.; et al. Occurrence of microplastic fragments in the Pasig River. H2Open. Journal. 2019, 2, 92-100.
27. Wagner, J.; Wang, Z.; Ghosal, S.; Rochman, C.; Gassel, M.; Wall, S. Novel method for the extraction and identification of microplastics in ocean trawl and fish gut matrices. Anal. Methods. 2017, 9, 1479-90.
28. Dissanayake, P. D.; Kim, S.; Sarkar, B.; et al. Effects of microplastics on the terrestrial environment: a critical review. Environ. Res. 2022, 209, 112734.
29. Nor, N. H.; Obbard, J. P. Microplastics in Singapore’s coastal mangrove ecosystems. Mar. Pollut. Bull. 2014, 79, 278-83.
30. Sutkar, P. R.; Gadewar, R. D.; Dhulap, V. P. Recent trends in degradation of microplastics in the environment: A state-of-the-art review. J. Hazard. Mater. Adv. 2023, 11, 100343.
31. Zhao, S.; Danley, M.; Ward, J. E.; Li, D.; Mincer, T. J. An approach for extraction, characterization and quantitation of microplastic in natural marine snow using Raman microscopy. Anal. Methods. 2017, 9, 1470-8.
32. Enders, K.; Lenz, R.; Stedmon, C. A.; Nielsen, T. G. Abundance, size and polymer composition of marine microplastics ≥ 10μm in the Atlantic Ocean and their modelled vertical distribution. Mar. Pollut. Bull. 2015, 100, 70-81.
33. Jung, M. R.; Horgen, F. D.; Orski, S. V.; et al. Validation of ATR FT-IR to identify polymers of plastic marine debris, including those ingested by marine organisms. Mar. Pollut. Bull. 2018, 127, 704-16.
34. Shruti, V.; Kutralam-muniasamy, G. Blanks and bias in microplastic research: Implications for future quality assurance. Trends. Environ. Anal. Chem. 2023, 38, e00203.
35. Fayyaz, A.; Asghar, H.; Waqas, M.; Kamal, A.; Al-Onazi, W. A.; Al-Mohaimeed, A. M. Multi-spectroscopic characterization of MgO/Nylon (6/6) polymer: evaluating the potential of LIBS and statistical methods. Polymers. (Basel). 2023, 15, 3156.
36. Wu, X.; Zhong, C.; Wang, T.; Zou, X. Assessment on the pollution level and risk of microplastics on bathing beaches: a case study of Liandao, China. Environ. Monit. Assess. 2023, 195, 383.
37. Eriksen, M.; Mason, S.; Wilson, S.; et al. Microplastic pollution in the surface waters of the Laurentian Great Lakes. Mar. Pollut. Bull. 2013, 77, 177-82.
38. Morgado, V.; Gomes, L.; Bettencourt, da. Silva. R. J. N.; Palma, C. Validated spreadsheet for the identification of PE, PET, PP and PS microplastics by micro-ATR-FTIR spectra with known uncertainty. Talanta 2021, 234, 122624.
39. Gulmine, J.; Janissek, P.; Heise, H.; Akcelrud, L. Polyethylene characterization by FTIR. Polymer. Testing. 2002, 21, 557-63.
40. Chinglenthoiba, C.; Mahadevan, G.; Zuo, J.; Prathyumnan, T.; Valiyaveettil, S. Conversion of PET bottle waste into a terephthalic acid-based metal-organic framework for removing plastic nanoparticles from water. Nanomaterials. (Basel). 2024, 14, 257.
41. Veerasingam, S.; Ranjani, M.; Venkatachalapathy, R.; et al. Contributions of fourier transform infrared spectroscopy in microplastic pollution research: a review. Crit. Rev. Env. Sci. Tec. 2021, 51, 2681-743.
42. Xu, J.; Thomas, K. V.; Luo, Z.; Gowen, A. A. FTIR and Raman imaging for microplastics analysis: state of the art, challenges and prospects. TrAC. Trend. Anal. Chem. 2019, 119, 115629.
43. Sekar, V.; Sundaram, B. Occurrence, quantification and characterisation of microplastics in Godavari River, India. Case. Stud. Chem. Environ. 2023, 8, 100542.
44. Kurniawan, S. B.; Said, N. S. M.; Imron, M. F.; Abdullah, S. R. S. Microplastic pollution in the environment: Insights into emerging sources and potential threats. Environ. Technol. Innov. 2021, 23, 101790.
45. Chen, Y.; Wen, D.; Pei, J.; et al. Identification and quantification of microplastics using Fourier-transform infrared spectroscopy: current status and future prospects. Curr. Opin. Environ. Sci. Health. 2020, 18, 14-9.
46. Wu, P.; Huang, J.; Zheng, Y.; et al. Environmental occurrences, fate, and impacts of microplastics. Ecotoxicol. Environ. Saf. 2019, 184, 109612.
47. Shaw, D. G.; Day, R. H. Colour- and form-dependent loss of plastic micro-debris from the North Pacific Ocean. Marine. Pollution. Bulletin. 1994, 28, 39-43.
48. Anuar, S. T.; Abdullah, N. S.; Yahya, N. K. E. M.; et al. A multidimensional approach for microplastics monitoring in two major tropical river basins, Malaysia. Environ. Res. 2023, 227, 115717.
49. Chinglenthoiba, C.; Pukhrambam, B.; Chanu, K. T.; et al. A review on microplastic pollution research in India. Reg. Stud. Mar. Sci. 2023, 58, 102777.
50. Dellisanti, W.; Leung, M. M.; Lam, K. W.; et al. A short review on the recent method development for extraction and identification of microplastics in mussels and fish, two major groups of seafood. Mar. Pollut. Bull. 2023, 186, 114221.
51. Xu, D.; Yin, X.; Zhou, S.; et al. A review on the remediation of microplastics using constructed wetlands: Bibliometric, co-occurrence, current trends, and future directions. Chemosphere 2022, 303, 134990.
52. Biale, G.; La, Nasa. J.; Mattonai, M.; et al. A systematic study on the degradation products generated from artificially aged microplastics. Polymers. (Basel). 2021, 13, 1997.
53. Manullang, C. Y.; Patria, M. P.; Haryono, A.; Anuar, S. T.; Suyadi, S.; Opier, R. D. A. Status and research gaps of microplastics pollution in indonesian waters: a review. Indones. J. Chem. 2023, 23, 251.
54. Spreafico, C.; Russo, D. Investigating the evolution of the technologies for collecting microplastics. J. Environ. Manage. 2023, 326, 116710.
55. Hardesty, B. D.; Harari, J.; Isobe, A.; et al. Using numerical model simulations to improve the understanding of micro-plastic distribution and pathways in the marine environment. Front. Mar. Sci. 2017, 4.
56. Ali, A. A. M.; Khalid, A. A.; Razak, N. I. A.; et al. A review on the presence of microplastics in environmental matrices within Southeast Asia: elucidating risk information through an analysis of microplastic characteristics such as size, shape, and type. Water. Emerg. Contam. Nanoplastics. 2024, 3, 12.
Cite This Article
How to Cite
Download Citation
Export Citation File:
Type of Import
Tips on Downloading Citation
Citation Manager File Format
Type of Import
Direct Import: When the Direct Import option is selected (the default state), a dialogue box will give you the option to Save or Open the downloaded citation data. Choosing Open will either launch your citation manager or give you a choice of applications with which to use the metadata. The Save option saves the file locally for later use.
Indirect Import: When the Indirect Import option is selected, the metadata is displayed and may be copied and pasted as needed.
About This Article
Copyright

Data & Comments
Data
0


Comments
Comments must be written in English. Spam, offensive content, impersonation, and private information will not be permitted. If any comment is reported and identified as inappropriate content by OAE staff, the comment will be removed without notice. If you have any queries or need any help, please contact us at [email protected].