

Phase-field-informed machine learning on creep behavior of Ni-based single-crystal superalloys
 0
0 Abstract
Creep strain characterizes the degree of creep damage and the creep life of superalloys. The creep process is accompanied by element redistribution and microstructure evolution; understanding the multi-characteristic relationships of creep morphology and strain/stress is essentially important for the design and prediction of superalloys. Accurate prediction of creep strain necessitates comprehensive feature data. In this work, a phase-field (PF)-informed machine learning (ML) is developed to investigate the creep strain of Ni-12.2Al-6Co-2.5Ta (at.%) superalloy. The creep damage crystal plasticity PF model is employed to simulate the creep morphology, composition and strain evolution. A ML-based quantitative prediction model for creep strain is established to assess the impact of composition and microstructure on creep behavior. Moreover, to enhance the accuracy and generalization of the ML model, statistical features are added using two-point analysis and principal component analysis (PCA) methods for characterizing the two-phase morphology. Additionally, the Shapley Additive Explanations algorithm is used to explain the intrinsic relationships of γ’ rafting, γ’ volume fraction, and creep strain. The phase classification model has an accuracy rate of over 99.2%; the mean square error of the quantitative creep strain prediction model is reduced from 0.304 to 0.235 by using two-point analysis and PCA dimensionality reduction. This study demonstrates the effectiveness of integrating PF information-driven ML in developing image recognition and creep performance prediction models for superalloys.

Keywords
INTRODUCTION
Nickel (Ni)-based superalloys are widely used in turbine blades and other high-temperature components due to their exceptional durability and resistance to creep under high-temperature and high-load conditions[1,2]. Under such conditions, creep is the primary deformation mechanism in Ni-based superalloys. During the creep process, element redistribution occurs; large-size elements such as Al, Ti and Ta tend to migrate to the γ’ phase, while small-size elements such as Cr, Co and Mo preferentially diffuse into the γ matrix[3,4]. The microstructure of Ni-based superalloys is closely related to their creep behavior. Under external loads, key morphological characteristics, such as γ’ phase rafts, volume fraction and particle number, undergo significant changes, directly affecting the superalloys’ creep properties[5,6]. Large γ’ phases act as obstacles to dislocation movement, thereby improving the creep performance[7]. Therefore, understanding the relationships between composition, microstructure and creep property is essential for improving the creep performance and evaluating damage assessment of Ni-based superalloys. Advanced methods are required to analyze creep strain, elemental distribution and rafting morphologies for the numerous features correlating with creep behavior.
Machine learning (ML) has shown powerful ability in the discovery of new materials, property prediction, and microstructure identification[8,9]. Recently, ML has been introduced to aid phase-field (PF) simulations[10], significantly accelerating materials research. Three primary strategies have emerged for integrating ML with PF simulations. (1) Accelerated Computation: ML models, such as convolutional neural networks (CNNs), recurrent neural networks (RNNs) and physics-informed neural networks (PINNs), have been utilized in PF simulations to identify microstructure evolution and solve partial differential equations enhancing computational efficiency[11,12]; (2) Feature Extraction and Property Prediction: key features extracted from PF simulation are analyzed using ML to study the relationships between materials descriptors and properties, to predict material properties and accelerate the material design. For example, by combining high-throughput PF simulations with ML approaches, Ti-Nb nanocomposites have been designed with optimized mechanical properties, and a compositionally graded ferroelectric shows superior piezoelectric performance[13,14]. Insights into the breakdown mechanism of polymer nanocomposite dielectrics optimize their breakdown strength[15]. The influences of morphology and spatial orientation of an oxide filler are revealed on the piezoelectric, mechanical, and dielectric properties of the piezoelectric nanocomposites[16]; (3) Understanding PF model parameters: ML also promotes the understanding of PF model parameters. As an example, Tso et al. explored the effect of PF parameters on γ’ size and morphology, providing valuable insights for model refinement[17].
The integration of PF with ML offers significant advantages. Firstly, as a high-throughput numerical simulation method, PF simulation can provide comprehensive mesoscopic data[18], including morphology data; for instance, 142 sets of relevant data are provided in this work. Its efficiency is not reached by ML models driven by experimental data. Secondly, PF simulation enables multi-scale coupling, connecting microscale and macroscale effects[10]. It is combined with the ML method to extend the scope of application in physical phenomena. Thirdly, the traditional physical models have complex theoretical analysis and modeling processes. In contrast, the combination of PF and ML is data-driven with simpler models and has a wider scope of application[19].
Although PF simulation can obtain the morphology and creep properties of superalloys based on the thermodynamic and kinetic principles[20], it is computationally intensive, especially for multi-component and three-dimensional systems. Therefore, combining data-treating techniques and prediction methods is essential for accelerating and optimizing PF simulation with ML-driven approaches.
In this study, we develop a strategy that extracts key features from the PF simulation, and builds a ML model to investigate the relationships between features and properties of superalloys. The creep process, which involves element redistribution and microstructure evolution[21], significantly influences creep properties. However, many aspects remain poorly understood. Firstly, the creep morphology and strain of Ni-12.2Al-6Co-2.5Ta (at.%) superalloy under different external stresses are quantitatively evaluated by PF simulation. Composition, microstructure and strain-related features as PF information are extracted for ML analysis. Secondly, the ML-based creep regression model is established based on these features. This model captures the comprehensive effects of element redistribution and microstructure on creep strain, leveraging the statistical capabilities of ML. Thirdly, to further optimize the creep regression model, we employ two-point statistics and principal component analysis (PCA) for dimensionality reduction. This study provides a novel approach to optimize ML models for predicting the creep strain of superalloys. Finally, we use the Shapley Additive Explanations (SHAP) algorithm to analyze and explain the relationships between key features and creep strain, offering more profound insights into creep behavior. ML can be used to further understand the creep behavior of Ni-based superalloys by using microstructure and composition information from PF.
MATERIALS AND METHODS
Data sources and PF simulation
Quantitative data obtained from PF simulation provide key parameters, including particle size, volume fraction, γ’ phase rafting morphology, and creep strain for use in ML. The creep damage theory coupled with the crystal viscoplasticity PF model[22] is used to simulate the creep evolution of Ni-12.2Al-6Co-2.5Ta (at.%) superalloy at 1,373 K[23].
The concentration fields ci (r, t) and long-range ordered (LRO) parameter fields ηp (r, t) (p = 1, 2, 3) are introduced in the PF model to describe the ordered L12-γ’ phase and disordered γ matrix; their evolutions are controlled by the Cahn-Hilliard diffusion equation and the time-dependent Ginzburg-Landau equation:
where ξc (r, t) and ξη (r, t) are noise items in composition and order parameters, respectively, which initiate nucleation and satisfy the fluctuation-dissipation theorem. Vm is the molar volume of the alloy, F is the total energy, Mi are the chemical mobilities of Al, Co, and Ta, and L is the interface mobility.
The total free energy F consists of chemical free energy, interfacial energy, and elastic strain energy[24],
where fch is the chemical free energy density coupling with the Kim-Kim-Suzuki model[25], fint is the interfacial energy density, and fel is elastic strain energy density.
The crystal viscoplasticity theory describes microscopic plastic deformation, where dislocation slip determines the plastic strain rate
where ms is the orientation tensor related to the slip plane ns and slip direction ls.
To obtain sufficient data for training and testing, the creep evolutions of the alloy are simulated under different external stresses usually used in creep experiments of Ni-based superalloys[28]: σxx = 190, 290, 380, 430, 480 and 580 MPa at 1,373 K. Order parameters η1, η2 and η3 representing the crystal orientation, along with the concentrations of Al, Co and Ta representing component distribution and creep strain, are recorded.
Figure 1 shows the resulting creep strain of Ni-12.2Al-6Co-2.5Ta (at.%) obtained from PF simulation under external stresses σxx =190, 290, 380, 430, 480 and 580 MPa at 1,373 K. It can be seen that increasing external stress leads to higher creep strain and shorter primary creep stage. The creep strain curves obtained by PF simulation under different stresses are similar to the experimental results[29,30]. While the differences in rafting morphology under tensile stresses are apparent, understanding the internal relationships between microstructure, composition and creep strain remains crucial for guiding superalloy design and evaluation. ML provides a robust method for revealing these internal relationships from data.

Figure 1. Creep curves of Ni-12.2Al-6Co-2.5Ta (at.%) under different external stresses at 1,373 K.
ML framework
This study identifies potential factors influencing creep strain and uses them as inputs for ML models. The potential factors taken into consideration include the partitioning coefficients KAl, KCo and KTa, γ’ rafting degree Ω, γ’ volume fraction Vf, the average edge-to-edge distance of γ’ precipitation phase Hγ’, γ’ particle radius r and the fraction of over-coarsened γ’ phase ROCγ’. After feature selection, the KAl, KCo, Ω, Vf and Hγ’ are identified as key input features. A regression model for predicting creep strain is established based on the PF data to mine the relationships between creep strain and key input features.
Figure 2 shows the workflow for predicting creep strain based on PF simulation and ML. Firstly, the microstructure and composition features are extracted through order parameters and compositions. Secondly, Feature selection and model optimization are performed, with the support vector machine regression (SVR) model achieving the best performance for creep strain prediction. Thirdly, statistical features are analyzed through the two-point correlation and PCA for dimensionality reduction, to improve the model accuracy on morphology recognition further. Finally, the SHAP algorithm is used to visualize and interpret the impact of key features on creep strain.
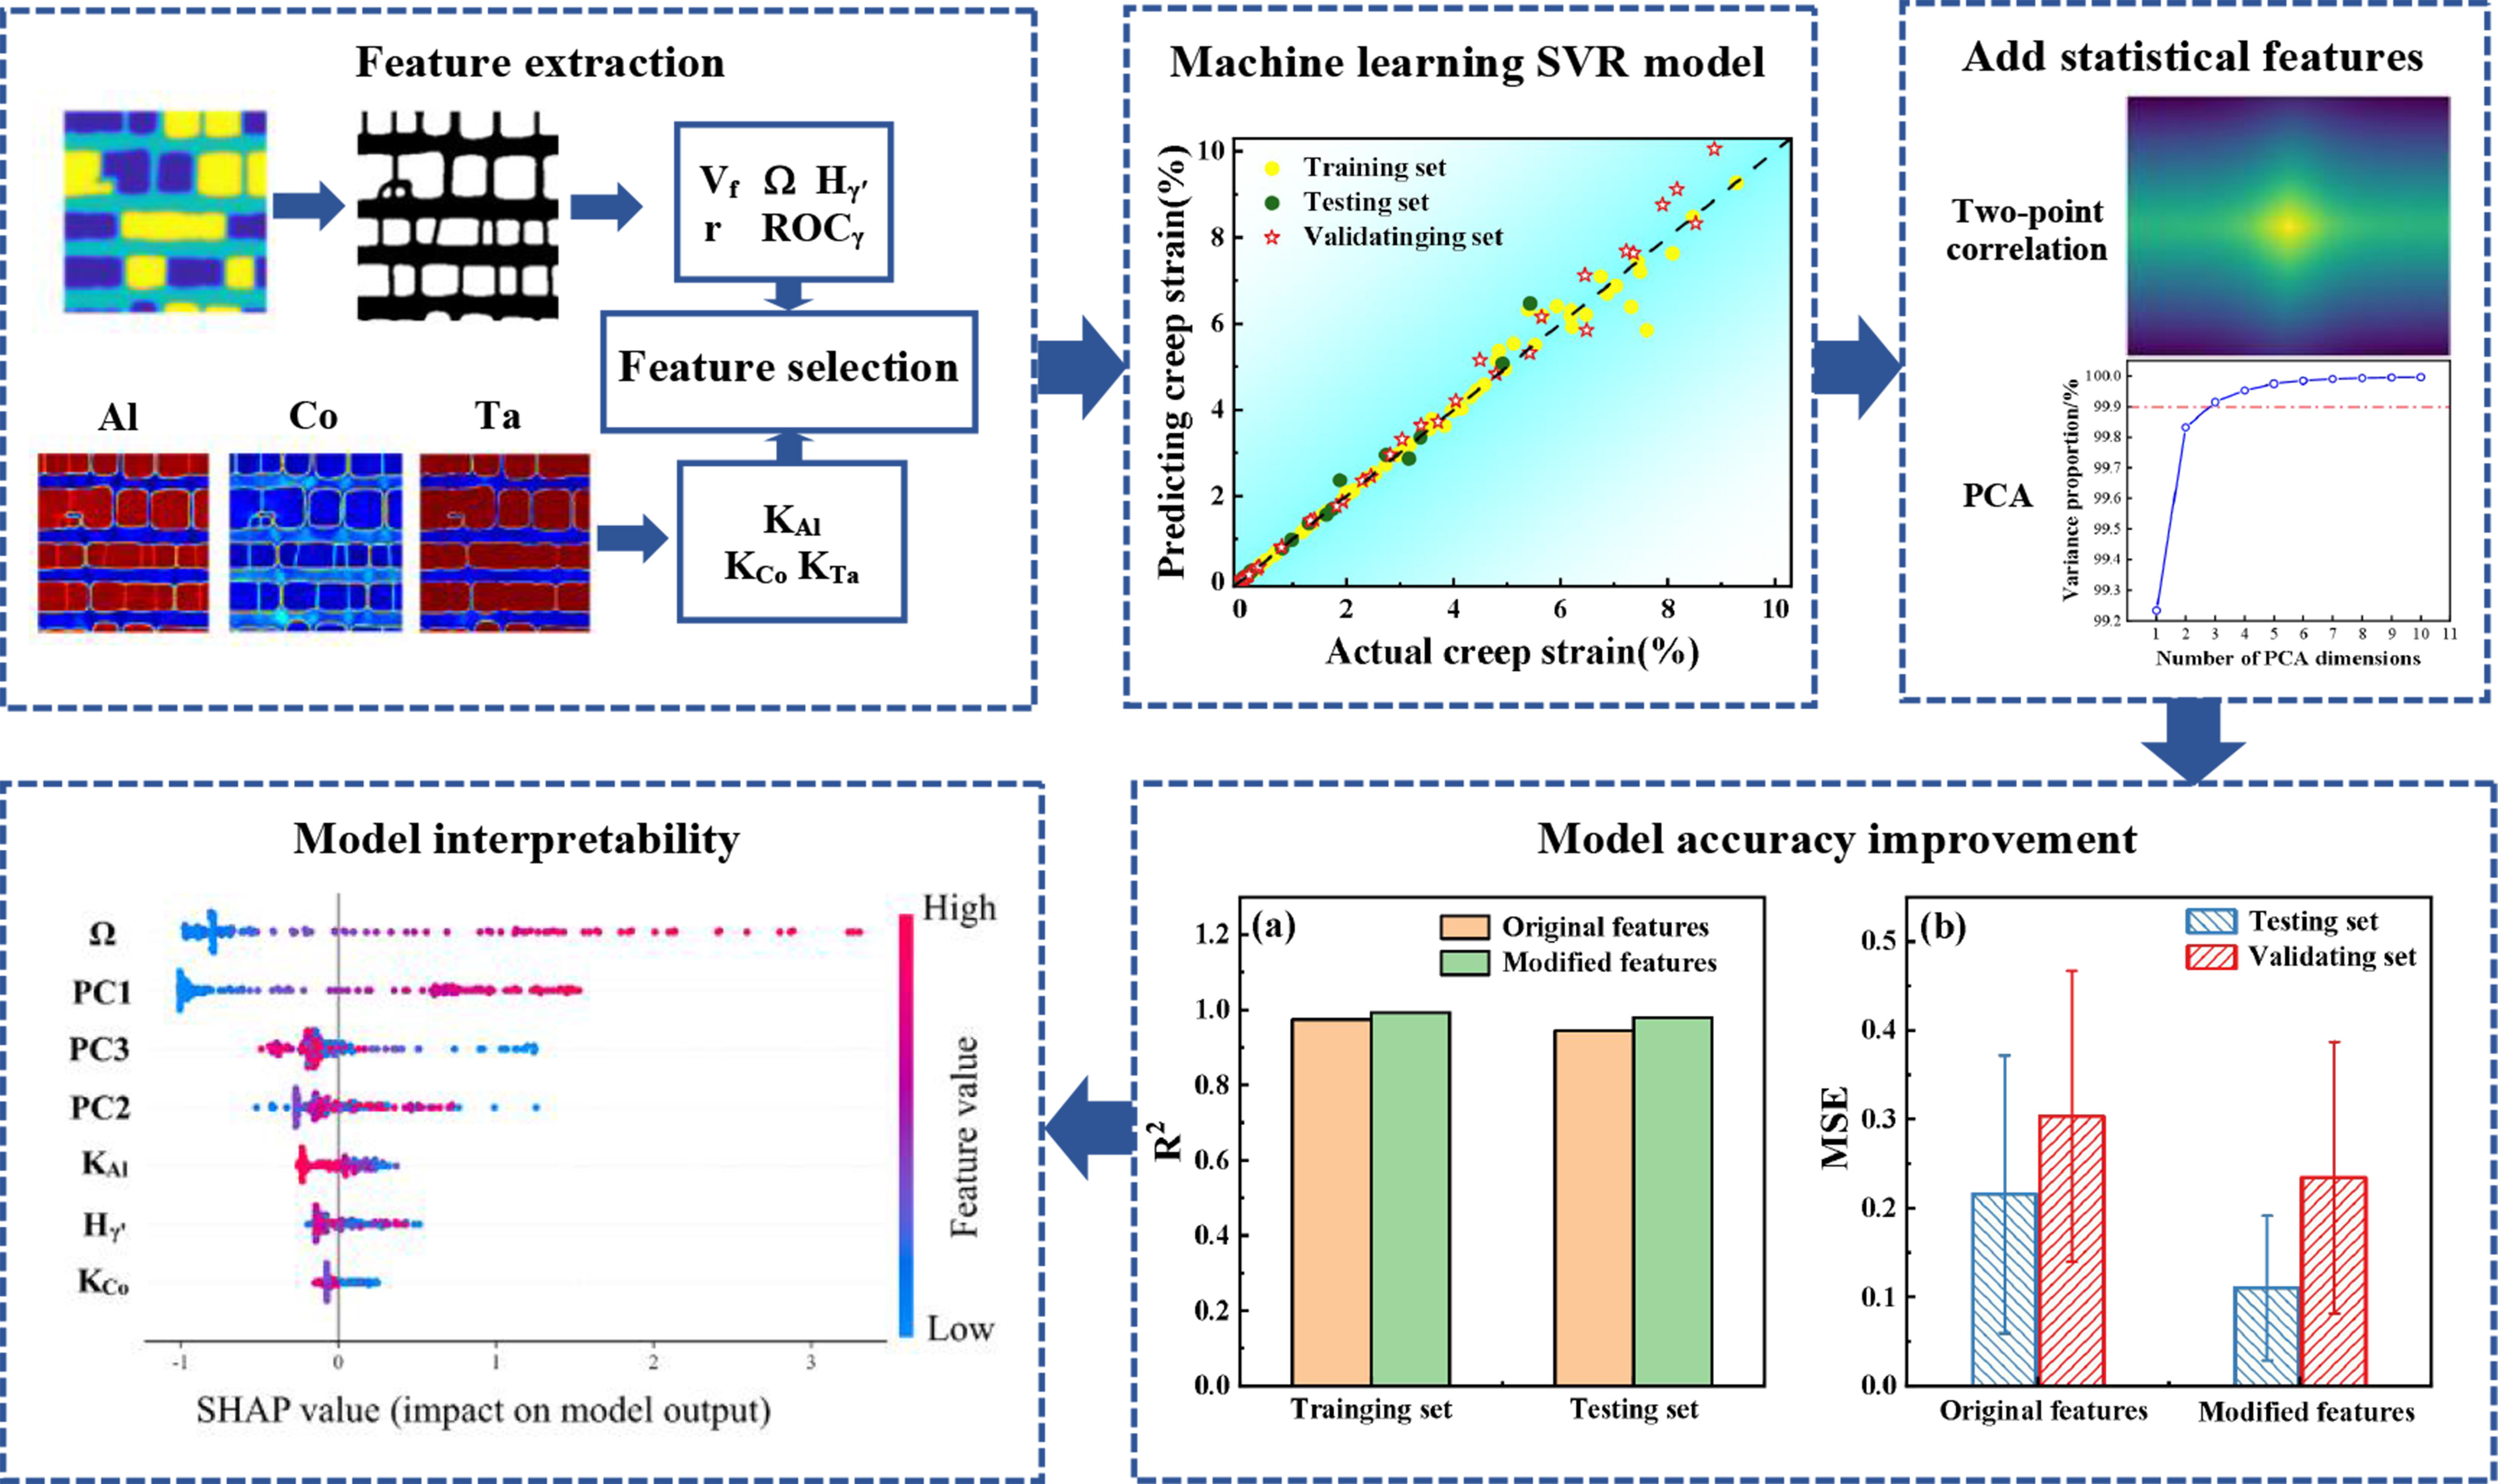
Figure 2. Flow chart for predicting creep strain of Ni-12.2Al-6Co-2.5Ta (at.%) based on PF simulation and ML. PF: Phase-field; ML: machine learning.
RESULTS AND DISCUSSION
U-Net model of phase classification
The U-Net model shows the ability to efficiently capture both spatial context and fine-grained details through its encoder-decoder architecture with skip connections, making it well-suited for accurate semantic segmentation tasks. Its proven performance in handling complex boundary details and adaptability to limited datasets further justified its selection[31-35]. Therefore, the U-Net semantic segmentation model is developed to classify and analyze the phase morphology obtained from PF simulation.
Figure 3A shows the input data of order parameters and their corresponding labeled γ’ phases. The order parameters η1, η2 and η3 represent the crystallographic orientations of the L12-γ’ phases[36]; (η1, η2, η3) = (1, 1, 1), (-1, 1, 1), (1, -1, 1), (1, 1, -1) represent the four ordered domains respectively. In the labeled images, white regions correspond to γ’ phases, and black regions represent γ matrix phases. The U-Net model framework, depicted in Figure 3B, consists of four down-sampling layers that transform the data from dimensions of 3 × 256 × 256 to 512 × 16 × 16. Subsequently, four up-sampling layers reshape the data back to 64 × 256 × 256. The final output is a prediction with dimensions of 2 × 256 × 256, generated using a softmax function. The error function is defined by the binary cross-entropy loss[37],

Figure 3. U-Net image classification model. (A) The order parameter diagrams composed of η1, η2, η3 as input data; the white regions represent the γ’ precipitate phase and black regions represent γ matrix phase; (B) framework diagram of the U-Net semantic segmentation model.
where N is the total number of samples, ys is the true value of the samples at sample point s, and
The classification results of the U-Net model are evaluated using confusion matrix, as shown in Table 1. Standard evaluation metrics[38] include mean intersection over union (mIoU), mean pixel accuracy (mPA) and accuracy rate (accuracy), which can be calculated by
Confusion matrix for classification results
| True/predicted | ||||
| Classification category | γ’/γ’ | γ’/γ | γ/γ | γ/γ’ |
| TP | FP | TN | FN | |
where true positive (TP) represents correctly predicted γ’ phase, true negative (TN) indicates correctly predicted γ matrix phase, false negative (FN) stands for γ’ phase predicted as γ matrix phase, and false positive (FP) refers to γ matrix phase predicted as γ’ phase.
After 50 training epochs, the binary cross-entropy loss of the training sets decreases from 0.675 to 0.0134, while the testing set loss decreases from 0.627 to 0.0178, as shown in Figure 4A. In Table 2, the accuracy for both training and testing sets exceeds 99.2%, indicating the model’s good ability to estimate the phase morphology.

Figure 4. Unet model results. (A) The relationship between the binary cross-entropy error of the training and testing sets and training iterations; (B) morphology evolution (t* = 1, 5, 10, 15) of Ni-12.2Al-6Co-2.5Ta (at.%) superalloy under the external stress σxx = 480 MPa at 1,373 K. G: Ground Truth, P: Predictions by the models.
Evaluation metrics for training and testing sets
| Source | mIoU | mPA | Accuracy |
| Training set | 98.51% | 99.13% | 99.3% |
| Testing set | 98.46% | 99.07% | 99.29% |
The phase prediction of the U-Net model is consistent with the actual phase morphologies, as shown in Figure 4B. The G line shows manually labeled phases from the testing set, while P line shows corresponding U-Net predictions. It is found that the inconsistencies are mainly located at phase interfaces of γ’/γ, as labeled by the red circles. Moreover, compared to the actual phases, the sharp angles are absent in the predicted images, and the optimal images can avoid the impact of sharp points of morphology feature in the process of extracting data. Thus, we consider the features extracted from classified images to be reliable. The U-Net model shows outstanding performance in semantic segmentation and can quickly distinguish the matrix phase and precipitation phase of the PF order parameters.
Microstructure and composition feature extraction
Input features are extracted by quantifying the microstructure and composition diagram from the PF simulations. In previous work, Fu et al. established a neural network model to evaluate the damage of turbine blades made of directionally solidified (DS) Ni-based superalloys, focusing on the relationship between microstructure evolution, external stress, time and temperature[39]. However, the literature results only considered the microstructure features; we extract key input features related to the composition and microstructure. From the composition diagram, the key feature is the partitioning coefficients Kiγ’/γ =
Several key microstructural features are extracted from the PF data, including γ’ rafting degree Ω, γ’ volume fraction Vf, average edge-to-edge distance Hγ’ between the vertical boundaries of the γ’ phase, γ’ particle radius r and fraction of over-coarsened γ’ phase ROCγ’. The Ω quantifies the alignment of γ’ precipitates and is calculated by[40]
where P┴L is the number of intersection points of the vertical γ’/γ interface, and P||L is the number of intersection points of the horizontal γ’/γ interface, as labeled by the schematic diagram in Figure 5A. These feature data are obtained by measuring multiple locations and the average value is used. ROCγ’ is the ratio of coarsened γ’ phase to the total γ’ phase area; the coarsened γ’ phase is defined by the following conditions[41]:

Figure 5. Extract schematic diagram of microstructure-related features. (A) Schematic diagram illustrating the measurement of P┴L, P||L and Hγ’; (B) schematic diagram of coarsened phase (red area).
(1) Aγ’ (single γ’ phase area) > 2.5 × AAγ’ (average precipitate area).
The coarsened γ’ phases, satisfying these conditions, are highlighted in red in Figure 5B.
Creep regression model
To ensure the reliability of the regression model and avoid multicollinearity among features[42], Pearson correlation analysis[43] is carried out on the extracted microstructure and composition features. Figure 6 shows the correlation coefficient between these features. Strong correlations can be observed in Vf, r, ROCγ’, and KTa. During the second creep stage, the rafted γ’ phase partly dissolves and fractures, generating smaller γ’ particles. Consequently, Vf exhibits a decrease at dissolution stage and a slight increase at the later stage, while r decreases and ROCγ’ increases due to the rafting of γ’ phase. Features with absolute correlation values greater than 0.8 are excluded to reduce redundancy. The final input features as PF information selected for the regression model include microstructure features Ω, Vf, Hγ’ and component features KAl and KCo. Table 3 summarizes these features, including their ranges and averages. The detailed data are given in the Supplementary Materials.

Figure 6. Pearson correlation coefficient between microstructure and composition features.
Input features for regression model
| No. | Descriptors | Range | Average |
| 1 | Ω | -0.2353 - 0.7922 | 0.0341 |
| 2 | Vf, % | 15.1459 - 48.5718 | 35.6839 |
| 3 | H γ’ pixel | 10.9665 - 16.2656 | 13.0814 |
| 4 | K Al | 1.0223 - 1.3546 | 1.2530 |
| 5 | K Co | 0.6328 - 1.5179 | 0.9429 |
Min-Max normalization is applied to the selected features to standardize them within specific ranges. The microstructure features are normalized to [-1, 1], while the component features to [0, 1]. In the training process, data corresponding to σxx = 190, 290, 380 and 580 MPa are used as the training and testing sets. A total of 108 data points are randomly allocated into training and testing sets at a ratio 4:1. The model is trained for 50 iterations. Validation is performed using data corresponding to σxx = 430 and 480 MPa, consisting of 34 data points, to evaluate the generalization capability of the model. Five common ML algorithms, SVR, lasso regression (LR), random forest regression (RF), decision tree regression (DT), and extreme gradient boosting regression (XGB), are implemented to establish prediction model for creep strain, using Python’s scikit-learn library[44]. Before evaluating the model performance, the methods of grid search and manual parameter adjustment are used to optimize the model performance. The models are evaluated using two performance metrics: determination coefficient (R2) and mean square error (MSE), which are expressed by
where yl is the actual value,
Figure 7 shows the performance of the five ML models trained for 50 iterations on the training, testing and validating sets. The results indicate that the SVR model performs best in predicting creep strain. The Lasso and DT models are inferior to SVR models in all data sets. Although the RF and XGB models outperform the SVR model in the training set, the performance in the testing and validating sets is far inferior to the SVR model, indicating overfitting. The testing set R2 of the SVR model is 0.965, the standard deviation is 0.0229 and the MSE is 0.216. The validation set R2 is 0.964, the standard deviation is 0.0195 and the MSE is 0.30. The SVR model can predict the magnitude of creep strain well with a smaller standard deviation and more stable performance.

Figure 7. The performance of ML models trained 50 times on training, testing and validating sets. (A) Average R2 and its standard deviation; (B) average MSE. ML: Machine learning; R2: determination coefficient; MSE: mean square error.
The lasso model is a linear model based on L1-paradigm regularization[45]. It is challenging to deal with the nonlinear relationship between creep strain, microstructure and composition features. As shown in Figure 7A, the DT, RF, and XGB models show some overfitting. The DT model simulates the decision-making process by constructing a tree structure[46], prone to model complexity and overfitting. The RF and XGB models are integrated models based on the DT model[47,48]; they are also prone to overfitting. In addition, due to the small dataset, it is difficult to describe the relationship accurately between the input features and the output features in the tree structure. Therefore, DT, RF and XGB models perform poorly in testing and validating sets of creep prediction. The SVR model uses radial basis function kernel to handle nonlinear relationships, enabling it to effectively analyze regression in high-dimensional spaces[49]. Moreover, the regularization term is introduced in the model; the model complexity can be effectively controlled. Therefore, the performance is stable in small datasets and the overfitting is avoided. In summary, it is obvious that the SVR model performs best in the creep prediction model. Therefore, subsequent model improvements only focus on the SVR model.
Add statistical features by two-point correlation and PCA
To further enhance the model’s performance and generalization, statistical features are obtained from the γ’ and γ two-phase microstructure by using the two-point correlation analysis[50] and PCA[51] to expand the feature space. Xu et al. demonstrated that incorporating statistical features of the first principal component (PC1) and the second principal component (PC2), obtained through these methods, significantly improved the performance of volume fraction prediction model and creep stress prediction model[52]. The two-point correlation has been proven to be an effective method for quantifying the microstructure of two-phase alloys[53]. The spatial position of the microstructure in the image space is calculated by
where φm is the area occupied by the phase m, and χpm expresses the probability density of phase m at position p. χpm appears in the form of two-point statistics; the two-point correlation of microstructure functions is calculated by
where r is the discrete vector space within the i-position domain. Applying fast Fourier transform (FFT) to Cmn(r) generates a two-point correlation diagram for phases m and n. Figure 8A-D presents the autocorrelation diagrams of microstructure and γ phase at t* = 5 and 15 under σxx = 430 MPa. In these diagrams, the center point of the γ phase autocorrelation diagram presents the γ phase volume fraction, while the surrounding regions capture intricate microstructure features.

Figure 8. Add statistical features by two-point correlation and PCA. (A-D) Microstructure and γ phase autocorrelation diagrams under
However, the original autocorrelation diagram dimensions (51 × 51) pose challenges due to high dimensionality, necessitating dimensionality reduction. The PCA is a common dimensionality reduction method that maps relevant data into a new feature space, which can transform the original data into the most relevant feature information. The PCA method can reduce the feature dimension while preserving the variance of the original data, as expressed by Y = XW, where X is the original feature after centralization, W is the transformation matrix composed of k feature vectors, and Y is the features after dimensionality reduction. Figure 8E shows the relationship between the number of PCA dimensions and retained variance. When the PCA dimensions are reduced to three, over 99.9% of the statistical feature variance is preserved, indicating that the first three principal components (PC1, PC2, PC3) can effectively represent the statistical features in the two-point correlation diagram. The embedded figure shows the PCA-reduced data (three dimensions), where the data evolution under different stresses (points with different colors) exhibits distinguishable patterns and discrete distributions along the direction of the arrows. The above statistical features and dimensionality reduction process are implemented by using the Python open-source package PyMKS[54].
Statistical features enhanced creep regression models
After adding statistical features, feature selection is refined by Pearson correlation analysis. As shown in Figure 9, after PCA dimensionality reduction, the correlation coefficient between PC1, PC2, and PC3 is 0, maximizing the feature space expansion. Furthermore, PC1 exhibits a correlation coefficient of -1 with Vf, showing a completely negative correlation because PC1 essentially reflects the volume fraction of the matrix phase. Finally, the SVR model is trained using microstructure features Ω and Hγ’, composition features KAl and KCo, and statistical features PC1, PC2 and PC3.
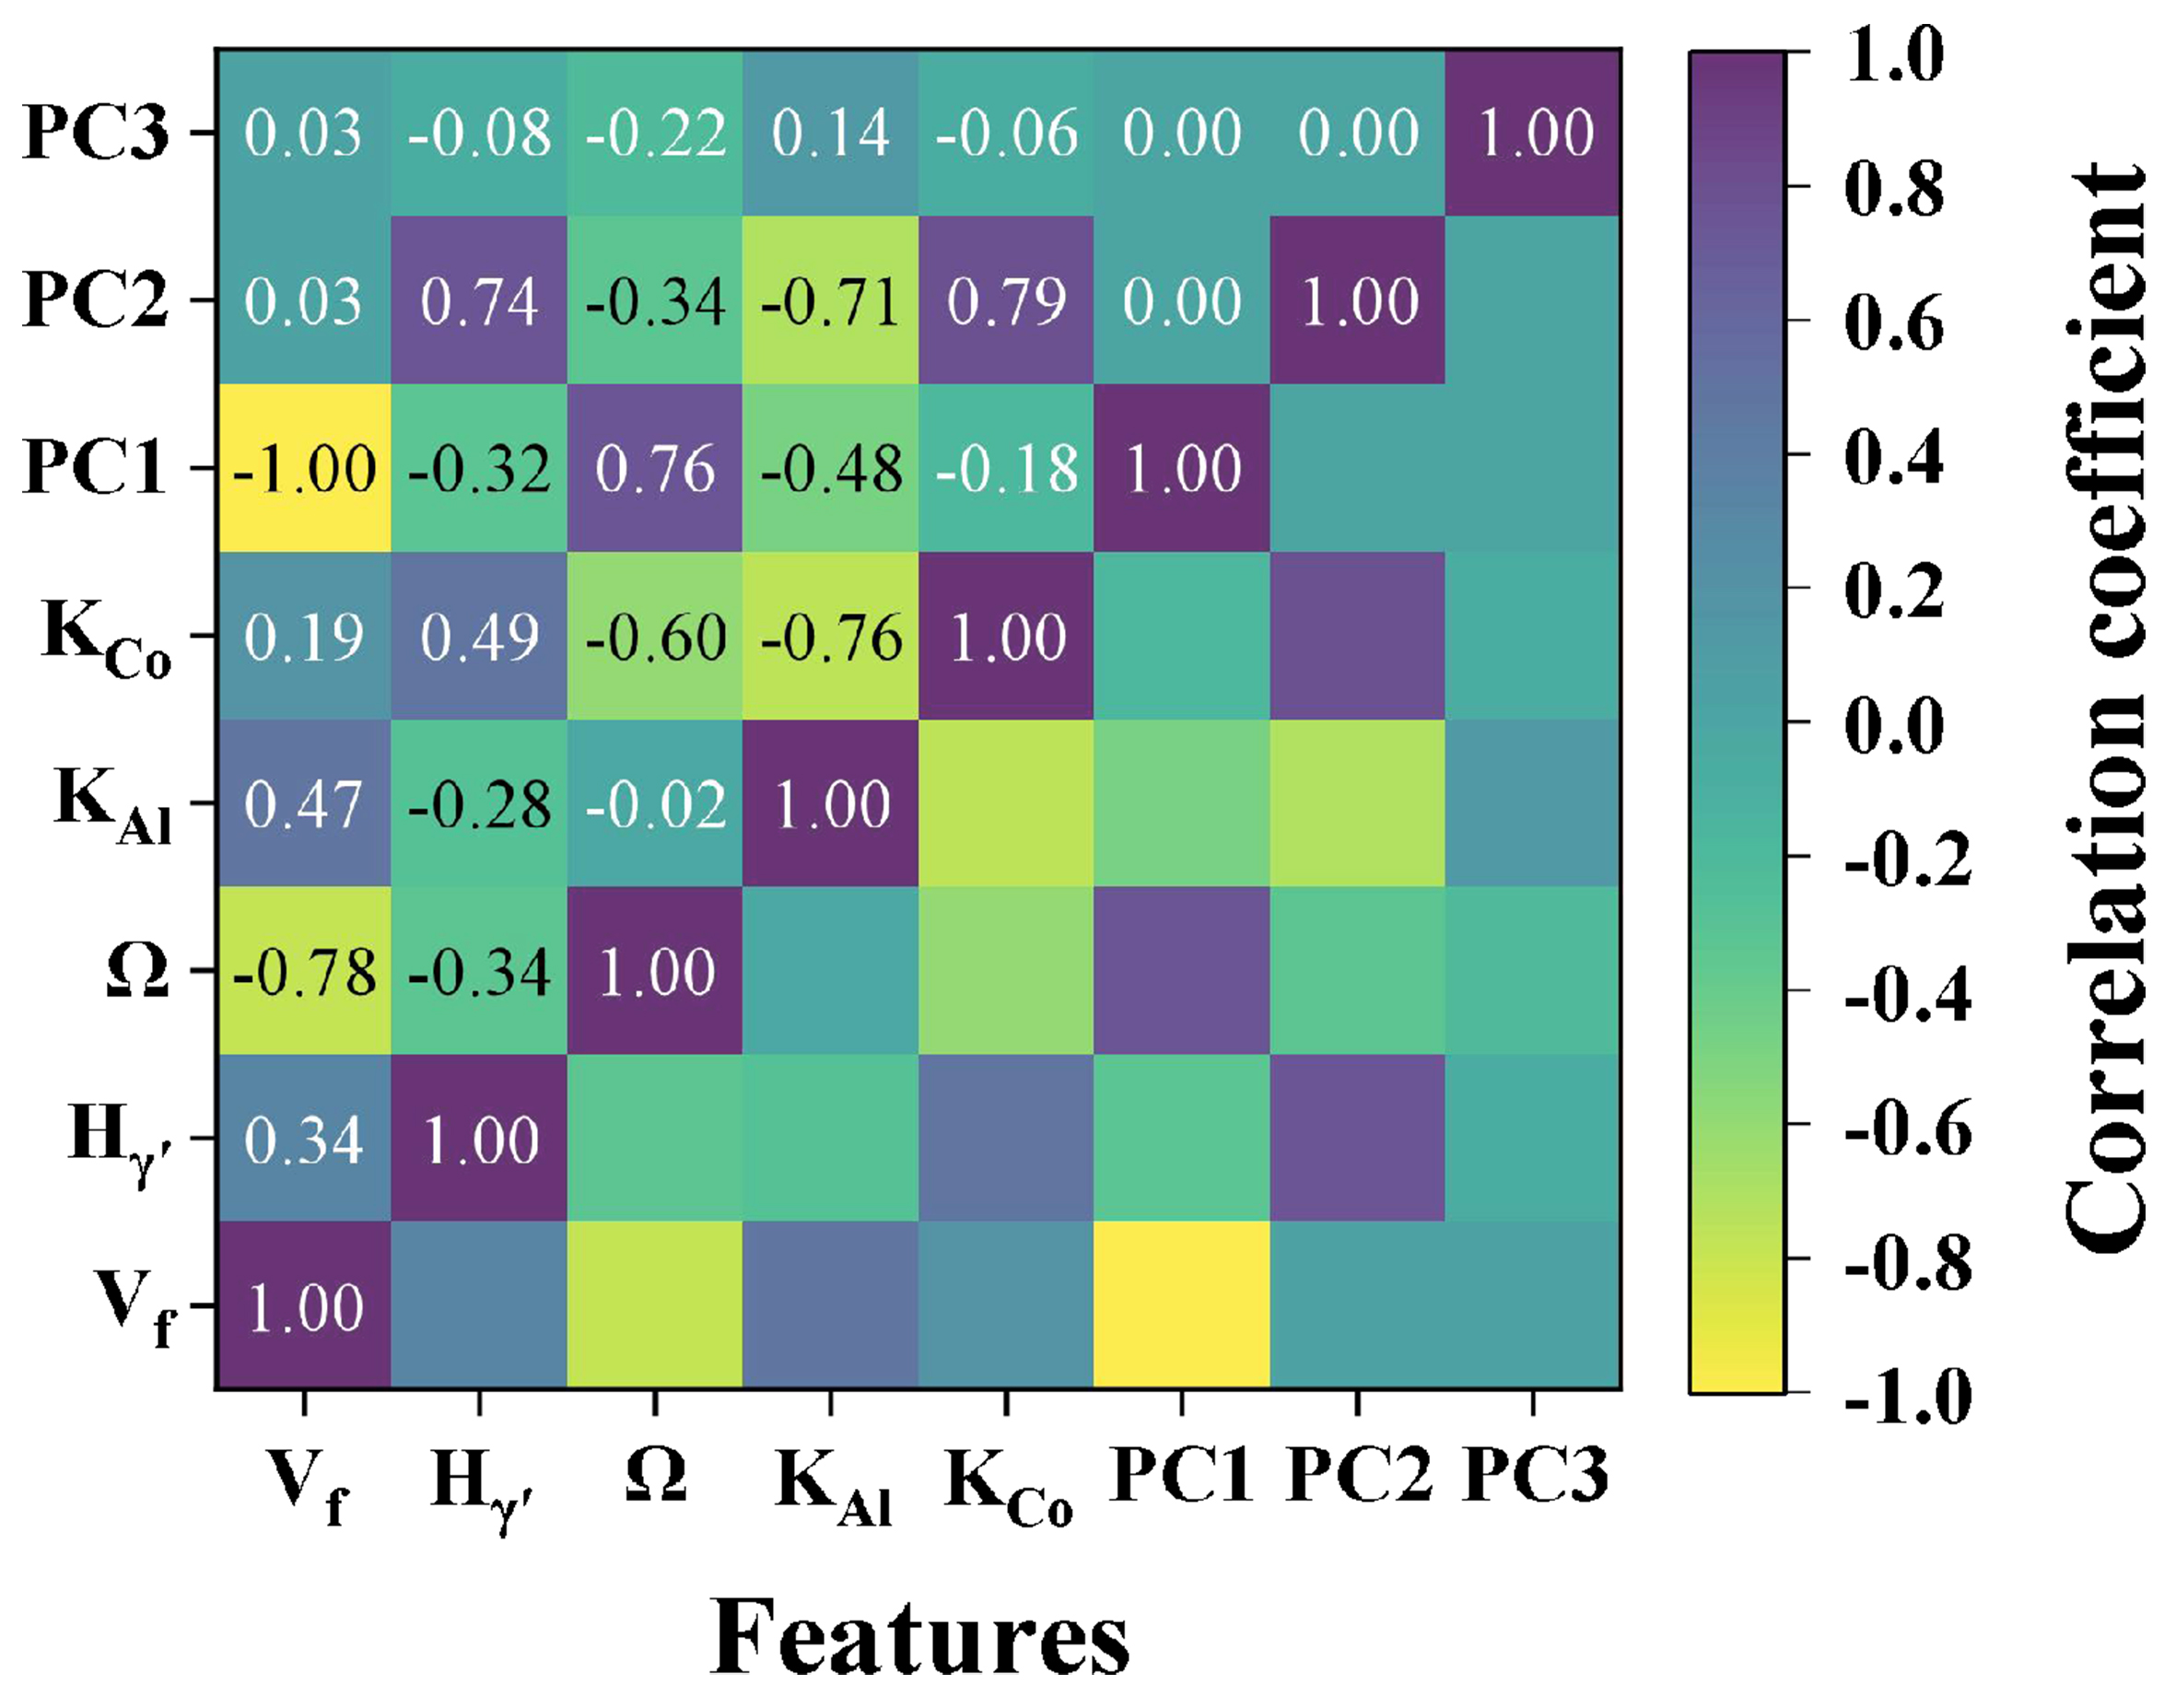
Figure 9. Pearson correlation coefficient between original input features and three PCA features. PCA: Principal component analysis.
The performance of the SVR model before and after adding statistical features is shown in Figure 10. In Figure 10A, the average R2 in the training and testing sets is evaluated by 5-fold cross-validation[55]. Before adding statistical features, R2 is 0.974 in training set and 0.944 in testing set. After adding PC1, PC2 and PC3, R2 values increase to 0.993 and 0.979, reaching improvements of 0.019 and 0.035, respectively. Figure 10B shows the MSE and its standard deviation for the testing and validating sets trained after 50 training iterations. For the testing and validating sets, the MSE decreases from 0.216 to 0.1105 with a standard deviation reduction of 0.106, and decreases from 0.304 to 0.235 with a standard deviation reduction of 0.011, respectively. These results demonstrate that adding statistical features enhances both accuracy and stability of the model, reducing prediction errors.

Figure 10. Comparison of SVR model performance before and after adding statistical features. (A) Average R2 for training and testing sets using 5-fold cross-validation; (B) average MSE and its standard deviation for the testing and validating sets over 50 training iterations; (C) scatter plot of predicted versus actual creep strain before adding statistical features; (D) after adding statistical features. SVR: Support vector machine regression; R2: determination coefficient; MSE: mean square error.
Figure 10C and D shows scatter plots of predicted versus actual creep strain for the training, testing and validating sets before and after adding statistical features PC1, PC2, and PC3. After feature enhancement, data points for the training and testing sets align more closely to the diagonal line. In the validation set, particularly for higher creep strain values, prediction errors are reduced significantly, indicating the improvement of generalization ability. The inclusion of PC1, PC2 and PC3 adds complementary information that captures deep microstructural characteristics not obtainable through conventional feature extraction methods. Two-point correlation provides a statistical and quantitative representation of a two-phase microstructure, while PCA can effectively reduce feature dimensionality without compromising data variance. Thus, by integrating these methods, we offer a robust approach to reflecting changes in the two-phase microstructure, improving model accuracy and reliability simultaneously.
Interpreting feature contributions to creep strain
The contribution of input features to model prediction can be analyzed using the SHAP, which interprets the impact of each feature on the output of the trained SVR model across all data[56]. Figure 11 shows the SHAP value distribution for each feature before and after feature correction. The horizontal axis represents the contribution of each feature to creep strain, while the color gradient (blue to red) represents the input feature values from low to high. From the figure, it can be seen that before feature enhancement, Ω and Vf are the most influential features affecting creep strain. Higher Ω and lower Vf correspond to greater creep strain. After feature enhancement, Ω and PC1 become the most significant predictors of creep strain. The correlation coefficient between Vf and PC1 is -1, indicating a perfect negative correlation. As PC1 reflects the volume fraction of the γ matrix phase, this relationship highlights its relevance in capturing critical microstructural changes during creep.

Figure 11. The distribution of SHAP values of each input feature. (A) The original features; (B) the modified features. SHAP: Shapley Additive Explanations.
The SHAP value distribution for Ω indicates that the γ’ rafting degree directly influences the creep strain. Since the creep process is a high-temperature deformation to form the rafted morphologies[57], the constant tensile stress applied to the Ni-based superalloy along the horizontal direction[58] can form the N-type rafts; the vertical thickness of γ’ particles becomes smaller while the horizontal γ channel becomes narrower. As a result, the greater rafting degree has a more significant creep strain.
From the distribution of SHAP values of Vf, we can find that the volume fraction of precipitates shows an inverse change to the creep strain; the smaller the volume fraction of precipitates, the greater the creep strain. The dynamic evolution process has been investigated and indicates that during the creep process, the initial γ’ phase undergoes rafting, partial dissolution and reprecipitation under the external stress[59-61], which is similar to the observation in 0Ru alloy after creep deformation under different external stresses at
The SHAP analysis shows the influence of Ω and Vf on the creep strain, and helps to understand microstructure changes in the creep process. In Figure 11A, after Ω and Vf, the subsequent significant features are Hγ’, KCo, KAl. The N-type rafts formed under horizontal tensile stresses; the γ matrix channel becomes wide in the vertical direction. Thus, the increased distance between γ’ phases affects the creep strain. Under the interactions of external stress at the γ/γ’ interfaces, the γ’ phase forming element Al diffuses from high-stress regions to low-stress regions to promote the rafting[64]. In addition, the diffusion rate of Al is greater than that of Co. Therefore, in Figure 11A, the change in the partition coefficient of Al fluctuates is more important than that of Co. In Figure 11B, PC3 and PC2 rank third and fourth in importance, further demonstrating the effectiveness of the two-point correlation and PCA methods in capturing crucial microstructure information. Moreover, the importance of PC3 and PC2 is greater than the composition features, indicating that microstructure strongly influences composition features.
Traditionally, creep strain prediction relies on physical models[65-67], which are complex, parameter-intensive, and require extensive experimental validation. In this study, we proposed leveraging component, microstructure and statistical features as inputs of the ML model. This approach offers a rapid and preliminary evaluation of damage during superalloy creep. Generally, it could be extended to other alloys using computational data from PF simulations or experimental images. High-efficient creep strain prediction, combined with interpretable ML, has the potential to accelerate the identification of key factors affecting service performance and promote innovative alloy design.
CONCLUSIONS
This work combines the PF simulation with ML to establish creep regression models using phase classification, component, and microstructural information. The two-point analysis and PCA methods improve the accuracy of the creep regression model. Moreover, the relationships between creep strain and key features are clarified using the SHAP algorithm. Using PF-informed ML helps understand creep behavior of Ni-based single-crystal superalloys. The conclusions are reached as follows.
(1) A phase classification model is developed using the U-Net CNN and PF order parameters. This method enables the efficient distinction between the matrix and precipitation phases in PF morphology.
(2) By combining PF simulation with ML, a regression model is established to predict the creep strain of Ni-12.2Al-6Co-2.5Ta (at.%) superalloys based on the composition and microstructure features.
(3) Adding statistical features derived from two-point correlation and PCA methods further improves the accuracy of the creep regression model. These methods effectively capture deeper microstructure information and provide accurate creep strain predictions.
(4) The SHAP algorithm visualizes the impacts of key features on creep strain. It reveals that the rafting degree of γ’ phase is directly related to the creep strain, while the volume fraction of γ’ phase shows an inverse relationship to the creep strain.
DECLARATIONS
Authors’ contributions
Writing-original draft: Song, J.; Shan, Y.
Conceptualization: Li, Y.
Writing-review and editing: Li, Y.; Huang, H.
Validation and visualization: Zhang, Z.; Wang, S.
Data curation and formal analysis: Zhang, H.; Muhammad, S.
All authors read and approved the final manuscript.
Availability of data and materials
The data are reflected in the Supplementary Materials.
Financial support and sponsorship
This work was supported by the National Natural Science Foundation of China (grant number 52275342).
Conflicts of interest
All authors declared that there are no conflicts of interest.
Ethical approval and consent to participate
Not applicable.
Consent for publication
Not applicable.
Copyright
© The Author(s) 2025.
Supplementary Materials
REFERENCES
1. Tan, L.; Yang, X.; Shi, D.; Huang, W.; Lyu, S.; Fan, Y. Effect of microstructure rafting on deformation behaviour and crack mechanism during high-temperature low-cycle fatigue of a Ni-based single crystal superalloy. Int. J. Fatigue. 2025, 190, 108619.
3. Ge, M.; Li, Y.; Wang, X.; et al. Effects of Ta on the high temperature creep behavior and deformation mechanism of a Ni-based single crystal superalloy. Mater. Sci. Eng. A. 2024, 916, 147335.
4. Ru, Y.; Zhang, H.; Pei, Y.; et al. Improved 1200 °C stress rupture property of single crystal superalloys by γ’-forming elements addition. Scr. Mater. 2018, 147, 21-6.
5. Xia, W.; Zhao, X.; Yue, L.; Zhang, Z. Microstructural evolution and creep mechanisms in Ni-based single crystal superalloys: a review. J. Alloys. Compd. 2020, 819, 152954.
6. Zhang, P.; Yuan, Y.; Niu, Q.; et al. Correlation microstructural evolution with creep-rupture properties of a novel directionally solidified Ni-based superalloy M4706. J. Mater. Sci. 2022, 57, 17812-27.
7. Murakumo, T.; Kobayashi, T.; Koizumi, Y.; Harada, H. Creep behaviour of Ni-base single-crystal superalloys with various γ’ volume fraction. Acta. Mater. 2004, 52, 3737-44.
8. Liu, Y.; Niu, C.; Wang, Z.; et al. Machine learning in materials genome initiative: a review. J. Mater. Sci. Technol. 2020, 57, 113-22.
9. Liu, P.; Huang, H.; Antonov, S.; et al. Machine learning assisted design of γ’-strengthened Co-base superalloys with multi-performance optimization. npj. Comput. Mater. 2020, 6, 334.
10. Zhao, Y. Understanding and design of metallic alloys guided by phase-field simulations. npj. Comput. Mater. 2023, 9, 1038.
11. Oommen, V.; Shukla, K.; Goswami, S.; Dingreville, R.; Karniadakis, G. E. Learning two-phase microstructure evolution using neural operators and autoencoder architectures. npj. Comput. Mater. 2022, 8, 876.
12. Yang, K.; Cao, Y.; Zhang, Y.; et al. Self-supervised learning and prediction of microstructure evolution with convolutional recurrent neural networks. Patterns 2021, 2, 100243.
13. Zhu, Y.; Xu, T.; Wei, Q.; et al. Linear-superelastic Ti-Nb nanocomposite alloys with ultralow modulus via high-throughput phase-field design and machine learning. npj. Comput. Mater. 2021, 7, 674.
14. Van Lich, L.; Nguyen, T.; Hong Hue, D. T.; et al. The design of compositionally modulated lead-free ferroelectrics with large electromechanical response via high-throughput phase-field simulations and machine learning. Mater. Res. Bull. 2023, 167, 112433.
15. Shen, Z. H.; Wang, J. J.; Jiang, J. Y.; et al. Phase-field modeling and machine learning of electric-thermal-mechanical breakdown of polymer-based dielectrics. Nat. Commun. 2019, 10, 1843.
16. Li, W.; Yang, T.; Liu, C.; et al. Optimizing piezoelectric nanocomposites by high-throughput phase-field simulation and machine learning. Adv. Sci. 2022, 9, e2105550.
17. Tso, W.; Wu, W.; Seidman, D. N.; Heinonen, O. G. Active learning sensitivity analysis of γ’(L12) precipitate morphology of ternary co-based superalloys. Materialia 2023, 28, 101760.
18. Xu, D.; Zhang, Q.; Huo, X.; Wang, Y.; Yang, M. Advances in data-assisted high-throughput computations for material design. Mater. Genome. Eng. Adv. 2023, 1, e11.
19. Karniadakis, G. E.; Kevrekidis, I. G.; Lu, L.; Perdikaris, P.; Wang, S.; Yang, L. Physics-informed machine learning. Nat. Rev. Phys. 2021, 3, 422-40.
20. Chen, L.; Zhao, Y. From classical thermodynamics to phase-field method. Prog. Mater. Sci. 2022, 124, 100868.
21. Qin, Q.; Zhang, Z.; Long, H.; Zhuo, J.; Li, Y. Prediction of creep properties of Co–10Al–9W superalloys with machine learning. J. Mater. Sci. 2024, 59, 4571-85.
23. Shan, Y.; Zhuo, J.; Song, J.; Niu, K.; Li, Y. Precipitation kinetics and creep properties of multicomponent Ni-based superalloys. J. Mater. Sci. 2024, 59, 20715-34.
24. Chen, J.; Guo, M.; Yang, M.; Zhang, J. Temperature dependence of kinetics pathway of γ’ precipitation in Co-Al-W superalloys: a phase-field study. J. Alloys. Compd. 2022, 922, 166319.
25. Zhou, N.; Shen, C.; Mills, M.; Wang, Y. Large-scale three-dimensional phase field simulation of γ’-rafting and creep deformation. Philos. Mag. 2010, 90, 405-36.
26. Wang, D.; Li, Y.; Shi, S.; Tong, X.; Yan, Z. Phase-field simulation of γ’ precipitates rafting and creep property of Co-base superalloys. Mater. Design. 2020, 196, 109077.
27. Utada, S.; Despres, L.; Cormier, J. Ultra-high temperature creep of Ni-based SX superalloys at 1250 °C. Metals 2021, 11, 1610.
28. Liu, Y.; Wu, J.; Wang, Z.; et al. Predicting creep rupture life of Ni-based single crystal superalloys using divide-and-conquer approach based machine learning. Acta. Mater. 2020, 195, 454-67.
29. Li, X.; Zhang, H.; Li, X.; et al. High-temperature creep behavior and damage mechanism of an advanced powder metallurgy Ni-based superalloy. Adv. Eng. Mater. 2024, 26, 2400230.
30. Omprakash, C. M.; Kumar, A.; Kamaraj, M.; Satyanarayana, D. V. V. Creep behaviour of directionally solidified nickel-base superalloy CM 247: a three-dimensional representation of creep curves. Trans. Indian. Inst. Met. 2021, 74, 1787-97.
31. Ronneberger, O.; Fischer, P.; Brox, T. . U-Net: convolutional networks for biomedical image segmentation. In Medical image computing and computer-assisted intervention - MICCAI 2015. Cham: Springer International Publishing; 2015. pp. 234-41.
32. Qin, Z.; Li, W.; Wang, Z.; et al. High-throughput characterization methods for Ni-based superalloys and phase prediction via deep learning. J. Mater. Res. Technol. 2022, 21, 1984-97.
33. Zhou, Z.; Siddiquee, M. M. R.; Tajbakhsh, N.; Liang, J. UNet++: a nested U-Net architecture for medical image segmentation. Deep. Learning. in. Medical. Image. Analysis. and. Multimodal. Learning. for. Clinical. Decision. Support. , pp 3-11.
34. He, K.; Zhang, X.; Ren, S.; Sun, J. . Deep residual learning for image recognition. In 2016 IEEE Conference on Computer Vision and Pattern Recognition (CVPR), Las Vegas, USA. Jun 27-30, 2016. IEEE, 2016; pp, 770-8.
35. Zhang, N.; Fu, H.; Liu, P.; et al. Machine learning-based quantitative analysis of metal ductile fracture surface. Materialia 2023, 32, 101904.
36. Wang, Y.; Banerjee, D.; Su, C.; Khachaturyan, A. Field kinetic model and computer simulation of precipitation of L12 ordered intermetallics from f.c.c. solid solution. Acta. Mater. 1998, 46, 2983-3001.
37. Kline, D. M.; Berardi, V. L. Revisiting squared-error and cross-entropy functions for training neural network classifiers. Neural. Comput. Appl. 2005, 14, 310-8.
38. Zhu, L.; Luo, Q.; Chen, Q.; et al. Prediction of ultimate tensile strength of Al-Si alloys based on multimodal fusion learning. Mater. Genome. Eng. Adv. 2024, 2, e26.
39. Fu, C.; Chen, Y.; Li, L.; Antonov, S.; Feng, Q. Evaluation of service conditions of high pressure turbine blades made of DS Ni-base superalloy by artificial neural networks. Mater. Today. Commun. 2020, 22, 100838.
40. Underwood, E. E. . The mathematical foundations of quantitative stereology. In: stereology and quantitative metallography. ASTM International, 1972; pp. 3-38.
41. Liu, P.; Huang, H.; Jiang, X.; et al. Evolution analysis of γ’ precipitate coarsening in Co-based superalloys using kinetic theory and machine learning. Acta. Mater. 2022, 235, 118101.
42. Murphy, K. P. . Machine learning: a probabilistic perspective. MIT Press, 2012. https://api.semanticscholar.org/CorpusID:17793133. (accessed 2025-03-26).
43. Kim, Y.; Kim, T.; Ergün, T. The instability of the Pearson correlation coefficient in the presence of coincidental outliers. Financ. Res. Lett. 2015, 13, 243-57.
44. Hao, J.; Ho, T. K. Machine learning made easy: a review of Scikit-learn Package in python programming language. J. Educ. Behav. Stat. 2019, 44, 348-61. https://www.researchgate.net/publication/331257851_Machine_Learning_Made_Easy_A_Review_of_Scikit-learn_Package_in_Python_Programming_Language. (accessed 2025-03-26).
45. Tibshirani, R. Regression shrinkage and selection via the lasso. J. R. Stat. Soc. B. 1996, 58, 267-88.
47. Vijayakumar, V.; Case, M.; Shirinpour, S.; He, B. Quantifying and characterizing tonic thermal pain across subjects from EEG data using random forest models. IEEE. Trans. Biomed. Eng. 2017, 64, 2988-96.
48. Ibraheem, R.; Dechent, P.; dos, R. e. i. s. . G. Path signature-based life prognostics of Li-ion battery using pulse test data. Appl. Energy. 2025, 378, 124820.
50. Cecen, A.; Fast, T.; Kalidindi, S. R. Versatile algorithms for the computation of 2-point spatial correlations in quantifying material structure. Integr. Mater. Manuf. Innov. 2016, 5, 1-15.
51. Wold, S.; Esbensen, K.; Geladi, P. Principal component analysis. Chemom. Intell. Lab. Syst. 1987, 2, 37-52.
52. Xu, J.; Li, L.; Liu, X.; Li, H.; Feng, Q. Quantitative models of high temperature creep microstructure-property correlation of a nickel-based single crystal superalloy with physical and statistical features. J. Mater. Res. Technol. 2022, 19, 2301-13.
53. Sengodan G. Prediction of two-phase composite microstructure properties through deep learning of reduced dimensional structure-response data. Compos. Part. B. Eng. 2021, 225, 109282.
54. Brough, D. B.; Wheeler, D.; Kalidindi, S. R. Materials knowledge systems in python - a data science framework for accelerated development of hierarchical materials. Integr. Mater. Manuf. Innov. 2017, 6, 36-53.
55. Zhang, Y.; Fang, Y.; Li, L.; et al. Thermal stability prediction of copolymerized polyimides via an interpretable transfer learning model. J. Mater. Inf. 2024, 4, 8.
56. Yu, L.; Zhai, J.; Cao, W.; Ren, J. Prediction of temperature-dependent yield strength of refractory high entropy alloy based on stacking integrated framework. J. Mater. Inf. 2024, 4, 28.
58. Touratier, F.; Andrieu, E.; Poquillon, D.; Viguier, B. Rafting microstructure during creep of the MC2 nickel-based superalloy at very high temperature. Mater. Sci. Eng. A. 2009, 510-511, 244-9.
59. Lu, S.; Luo, Z.; Lu, F.; Li, L.; Feng, Q. Creep performance in a CoNi-based single crystal superalloy with super-high γ’ volume fraction at 760 °C and equivalent high stress. J. Mater. Res. Technol. 2024, 29, 4870-80.
60. Ju, Y.; Long, H.; Qin, Q.; Wang, S.; Shan, Y.; Li, Y. Creep property and rafting kinetics of Co-based monocrystal superalloys with antiphase boundaries of γ’ phase. Mater. Sci. Eng. A. 2023, 880, 145283.
61. Antonov, S.; An, W.; Utada, S.; et al. . Evaluation and comparison of damage accumulation mechanisms during non-isothermal creep of cast Ni-based superalloys. In: Tin S, Hardy M, Clews J, Cormier J, Feng Q, Marcin J, O’brien C, Suzuki A, editors. Superalloys 2020. Cham: Springer International Publishing; 2020. pp. 228-39.
62. Wang, X.; Liu, J.; Jin, T.; et al. Effects of temperature and stress on microstructural evolution during creep deformation of Ru-free and Ru-containing single crystal superalloys. Adv. Eng. Mater. 2015, 17, 1034-44.
63. Coakley, J.; Ma, D.; Frost, M.; et al. Lattice strain evolution and load partitioning during creep of a Ni-based superalloy single crystal with rafted γ’ microstructure. Acta. Mater. 2017, 135, 77-87.
64. Liu, P.; Zhang, Z.; Liu, X.; et al. Study on the mechanism of γ’ phase rafting in a 4th generation nickel-based single crystal superalloy during thermal exposure at high temperatures. J. Alloys. Compd. 2024, 980, 173594.
65. Barrett, P. R.; Hassan, T. A unified constitutive model in simulating creep strains in addition to fatigue responses of Haynes 230. Int. J. Solids. Struct. 2020, 185-6, 394-409.
66. Xu, K.; Wang, G.; Liu, J.; et al. Creep behavior and a deformation mechanism based creep rate model under high temperature and low stress condition for single crystal superalloy DD5. Mater. Sci. Eng. A. 2020, 786, 139414.
Cite This Article
How to Cite
Download Citation
Export Citation File:
Type of Import
Tips on Downloading Citation
Citation Manager File Format
Type of Import
Direct Import: When the Direct Import option is selected (the default state), a dialogue box will give you the option to Save or Open the downloaded citation data. Choosing Open will either launch your citation manager or give you a choice of applications with which to use the metadata. The Save option saves the file locally for later use.
Indirect Import: When the Indirect Import option is selected, the metadata is displayed and may be copied and pasted as needed.
About This Article
Copyright

Data & Comments
Data
0


Comments
Comments must be written in English. Spam, offensive content, impersonation, and private information will not be permitted. If any comment is reported and identified as inappropriate content by OAE staff, the comment will be removed without notice. If you have any queries or need any help, please contact us at [email protected].