

Symbolic regression accelerates the discovery of quantitative relationships in rubber material aging
 0
0  ,
,
Abstract
Polymer materials, especially rubber, play an indispensable role in modern life and manufacturing. However, their aging and deterioration pose serious challenges to their stability and service life. Unexpected aging can lead to the deterioration of the physical and chemical properties of materials, thereby triggering a series of safety hazards and environmental pollution issues. Exploring the correspondence between the microscopic characteristics and macroscopic properties of materials during the aging process helps researchers deeply understand and control the aging process of materials. Symbolic regression (SR) algorithm, as a machine learning method with strong interpretability, plays an important role in exploring the quantitative relationship of data in scientific fields. This method has a strong potential for discovering the intrinsic quantitative relationships within the experimental data of material aging. In this study, we propose a comprehensive evaluation framework for SR, aiming to identify SR algorithms that are truly suitable for aging experimental data. Furthermore, by integrating characterization data of aging experiments, we conduct further validation and knowledge discovery with the selected method. The results obtained from our experimental data demonstrate a strong consistency with those of the proposed evaluation framework. Notably, this research methodology exhibits extensibility and can serve as a guiding light for the discovery of knowledge and the elucidation of mechanisms within other realms of polymer materials and diverse material systems.
Keywords
INTRODUCTION
Polymer materials, especially rubber materials, have a significant presence in the Chinese market and are widely utilized in diverse fields. However, aging problems are inevitable, with oxygen-participating aging being commonly observed. Research on aging mechanisms is carried out through multiple methods, including experimental characterization, theoretical models, simulation-based approaches, and data-driven methods.
Experimental characterization focuses on detecting various changes during the aging process across four main aspects: chemical composition, microstructure, surface morphology, and macroscopic properties. For chemical composition and elemental analysis, techniques such as X-ray photoelectron spectroscopy (XPS) are used to analyze the elemental composition and chemical structure[1-3], while infrared spectroscopy (IR) helps measure the content of specific functional groups[4-6], revealing alterations in the types and amounts of chemical elements and compounds. In terms of microstructure analysis, changes in the spatial structure, such as the distortion or rearrangement of polymer chains in three-dimensional space, are examined with X-ray diffraction (XRD)[7-9]. XRD serves as a valuable technique to assess the crystalline structure and analyze the degree of aging by evaluating changes in peak positions, intensities, and crystallinity, offering insights into how aging impacts the material’s microstructure. Surface morphology analysis involves studying changes such as roughness, cracks, or deformations on the material’s surface. Atomic force microscopy (AFM) is commonly used for high-resolution imaging of surface topography, enabling the detection of subtle changes in surface features such as roughness and cracking[10-14]. Additionally, macroscopic property analysis, including measurements of mechanical strength, flexibility, and color, provides essential data for understanding aging mechanisms. For example, dynamic mechanical analysis (DMA) can be used to examine changes in the viscoelastic properties of the material[15,16], while tensile property measurements offer insights into changes in strength and elasticity[17,18], which help in understanding how aging affects the material’s overall performance. These comprehensive analyses allow for a deeper understanding of the material’s degradation process, aiding in the prediction of its service life under various conditions.
Theoretical models are proposed to better understand and predict the aging behavior of materials[19]. The Arrhenius equation is a typical example, which is used to calculate reaction rate constants. By considering factors such as temperature and activation energy, it reveals the relationship between reaction rates and aging time. This equation helps in predicting how the rate of aging will change under different environmental conditions and provides a basis for estimating the lifespan of the material[20].
Simulation calculations are another important type of method to describe the aging process. Molecular dynamics (MD) simulations track molecular movement and interaction over time to show how molecular changes affect macroscopic properties, such as how polymer chain rearrangement due to stress alters material stiffness or elasticity[21]. The diffusion of small gas molecules in rubber materials can affect the aging of the materials. MD can simulate the diffusion behavior of small molecules in rubber to obtain the most likely aging sites and degrees of rubber materials[22]. It can also be used to simulate the hygrothermal aging of fiber materials[23]. Quantum mechanics (QM) methods precisely describe electronic structures to study electronic effects in aging, such as how light/heat-induced electron excitation leads to reactions such as free radical formation and chain scission[24].
Data-driven approaches combine simulation calculations with experimental data. Image data generated during aging can be classified to identify specific material change features. Spectral data, such as infrared or nuclear magnetic resonance (NMR) spectra, can be used to construct feature vectors that reflect material property changes. These data are then analyzed using machine learning methods to assess how microscopic structural changes influence the overall system’s performance[25,26].
The aging of rubber materials is largely reflected in changes in mechanical properties. Predicting macroscopic mechanical properties based on microscopic changes in material composition and structure plays a crucial role in understanding aging and predicting service life. However, there is still limited research exploring the relationship between microscopic and macroscopic properties of aging materials[27-30], particularly in terms of identifying quantitative correlations. In the current research paradigm, expert knowledge and theoretical models have their limitations and may not fully capture the complex relationships in real-world systems, leading to inaccurate predictions. Simulation calculations are highly complex and require substantial computational resources. Data-driven methods often lack interpretability, as they do not adequately explain the underlying mechanisms behind the predicted results.
Consequently, symbolic regression (SR) algorithms are introduced for material aging research. SR, a distinct machine learning approach, constructs mathematical models from input data without prior assumptions about the model form. It explores a mathematical expression space comprising operators, variables, constants, and functions. The core strength of SR is its intelligent search within the symbolic combination space to identify the optimal model for a dataset, providing highly interpretable analytical solutions. Unlike traditional machine learning, SR autonomously discovers hidden patterns and relationships.
Traditional SR methods, such as polynomial interpolation and curve fitting, have limitations. The sparse identification of nonlinear dynamics (SINDy) method[31] uses sparse regression with a predefined term library, restricting its scope. Hopcroft proposed an expression tree generation method[32]. Genetic programming (GP) is sensitive to parameters and unstable. With the advent of deep learning, models such as End-to-end SR (E2E)[33], SymbolicGPT[34] and AIFeynman[35] use neural networks for variable analysis and expression search. Deep reinforcement learning methods, e.g., deep symbolic regression (DSR)[36], employ recursive neural networks to generate expressions and a quantile-based reward strategy to avoid training instability. The unified DSR (uDSR)[37] model combines multiple SR-solving strategies, achieving better performance in SRBench[38] tasks.
SR algorithms have found extensive applications in the materials field[39]. He et al. compared the SR algorithm with common machine learning techniques and demonstrated that the SR algorithm can be used to classify materials and describe material stability[40]. Abdusalamov et al. developed a new procedure based on the SR algorithm to automatically generate interpretable hyperelastic material models, which are highly consistent with experimental data[41]. In materials science, the selection of descriptors is essential for material characterization. SR plays a significant role in choosing and defining material descriptors, thereby facilitating the prediction of material properties. For instance, it has been employed to predict perovskite Landau free energy expressions[39], obtaining function forms consistent with real values. It can also be applied to infrared spectral data to forecast properties such as bond energy[42].
However, when it comes to polymer materials, especially in the context of rubber material aging, the application of SR remains unexplored. The potential of SR in understanding the aging mechanisms of rubber materials has not been tapped. Rubber materials, as polymer materials, inherently possess an amorphous characteristic, and the materials themselves have a certain degree of uncertainty, such as the molecular weight being a distribution. Therefore, the measurement of polymer materials has a certain amount of noise. In addition to the problem of noise, there are also the impacts of data scarcity and irrelevant variables. Due to the above conditions, it is difficult to obtain interpretable quantitative relationships through expert knowledge and black-box models. We aim to verify the feasibility of SR methods on aging data and apply them to the discovery of quantitative relationships in rubber aging.
Moreover, in terms of evaluating the specific scientific discovery potential of SR, there are also deficiencies. Currently, the performance evaluation of SR algorithms is mostly based on artificial datasets, which do not conform to the characteristics of experimental data. Although Matsubara et al. proposed a more realistic SR evaluation framework, it still did not fully describe the characteristics of real experimental data[43]. This mismatch between evaluation datasets and real experimental data restricts a more accurate and comprehensive understanding of the capabilities and limitations of SR in the context of material aging research. As a result, the full exploration of its role in uncovering the quantitative relationships of rubber material aging is hindered, further emphasizing the need for a more suitable evaluation framework and in-depth investigation in this area.
This study focuses on the evaluation of SR algorithms and their application to experimental data of rubber material aging, with the aim of obtaining more robust quantitative relationships between microscopic structure characterization and macroscopic properties. The major contributions of this study are as follows:
1. A Comprehensive Evaluation Framework for SR: Unlike existing algorithm evaluations centered on benchmark datasets lacking physical meaning, this paper assesses SR across diverse real-world scenarios, including data paucity, noise, and extraneous variables, to gauge its practical viability in real-world applications.
2. SR Application in Rubber Aging: This study is the pioneer attempt to utilize SR for unveiling and modeling the quantitative relationships of micro-macro aging mechanisms in polymer materials based on experimental data. It offers potential revelations of relationships eluding traditional methods.
3. Quantitative Relationship Discovery: By applying SR to aging experimental data, this research presents quantitative connections between the microscopic traits and macroscopic performance of aging materials, providing rational explanations that enhance the understanding of aging phenomena in particular polymer material systems.
MATERIALS AND METHODS
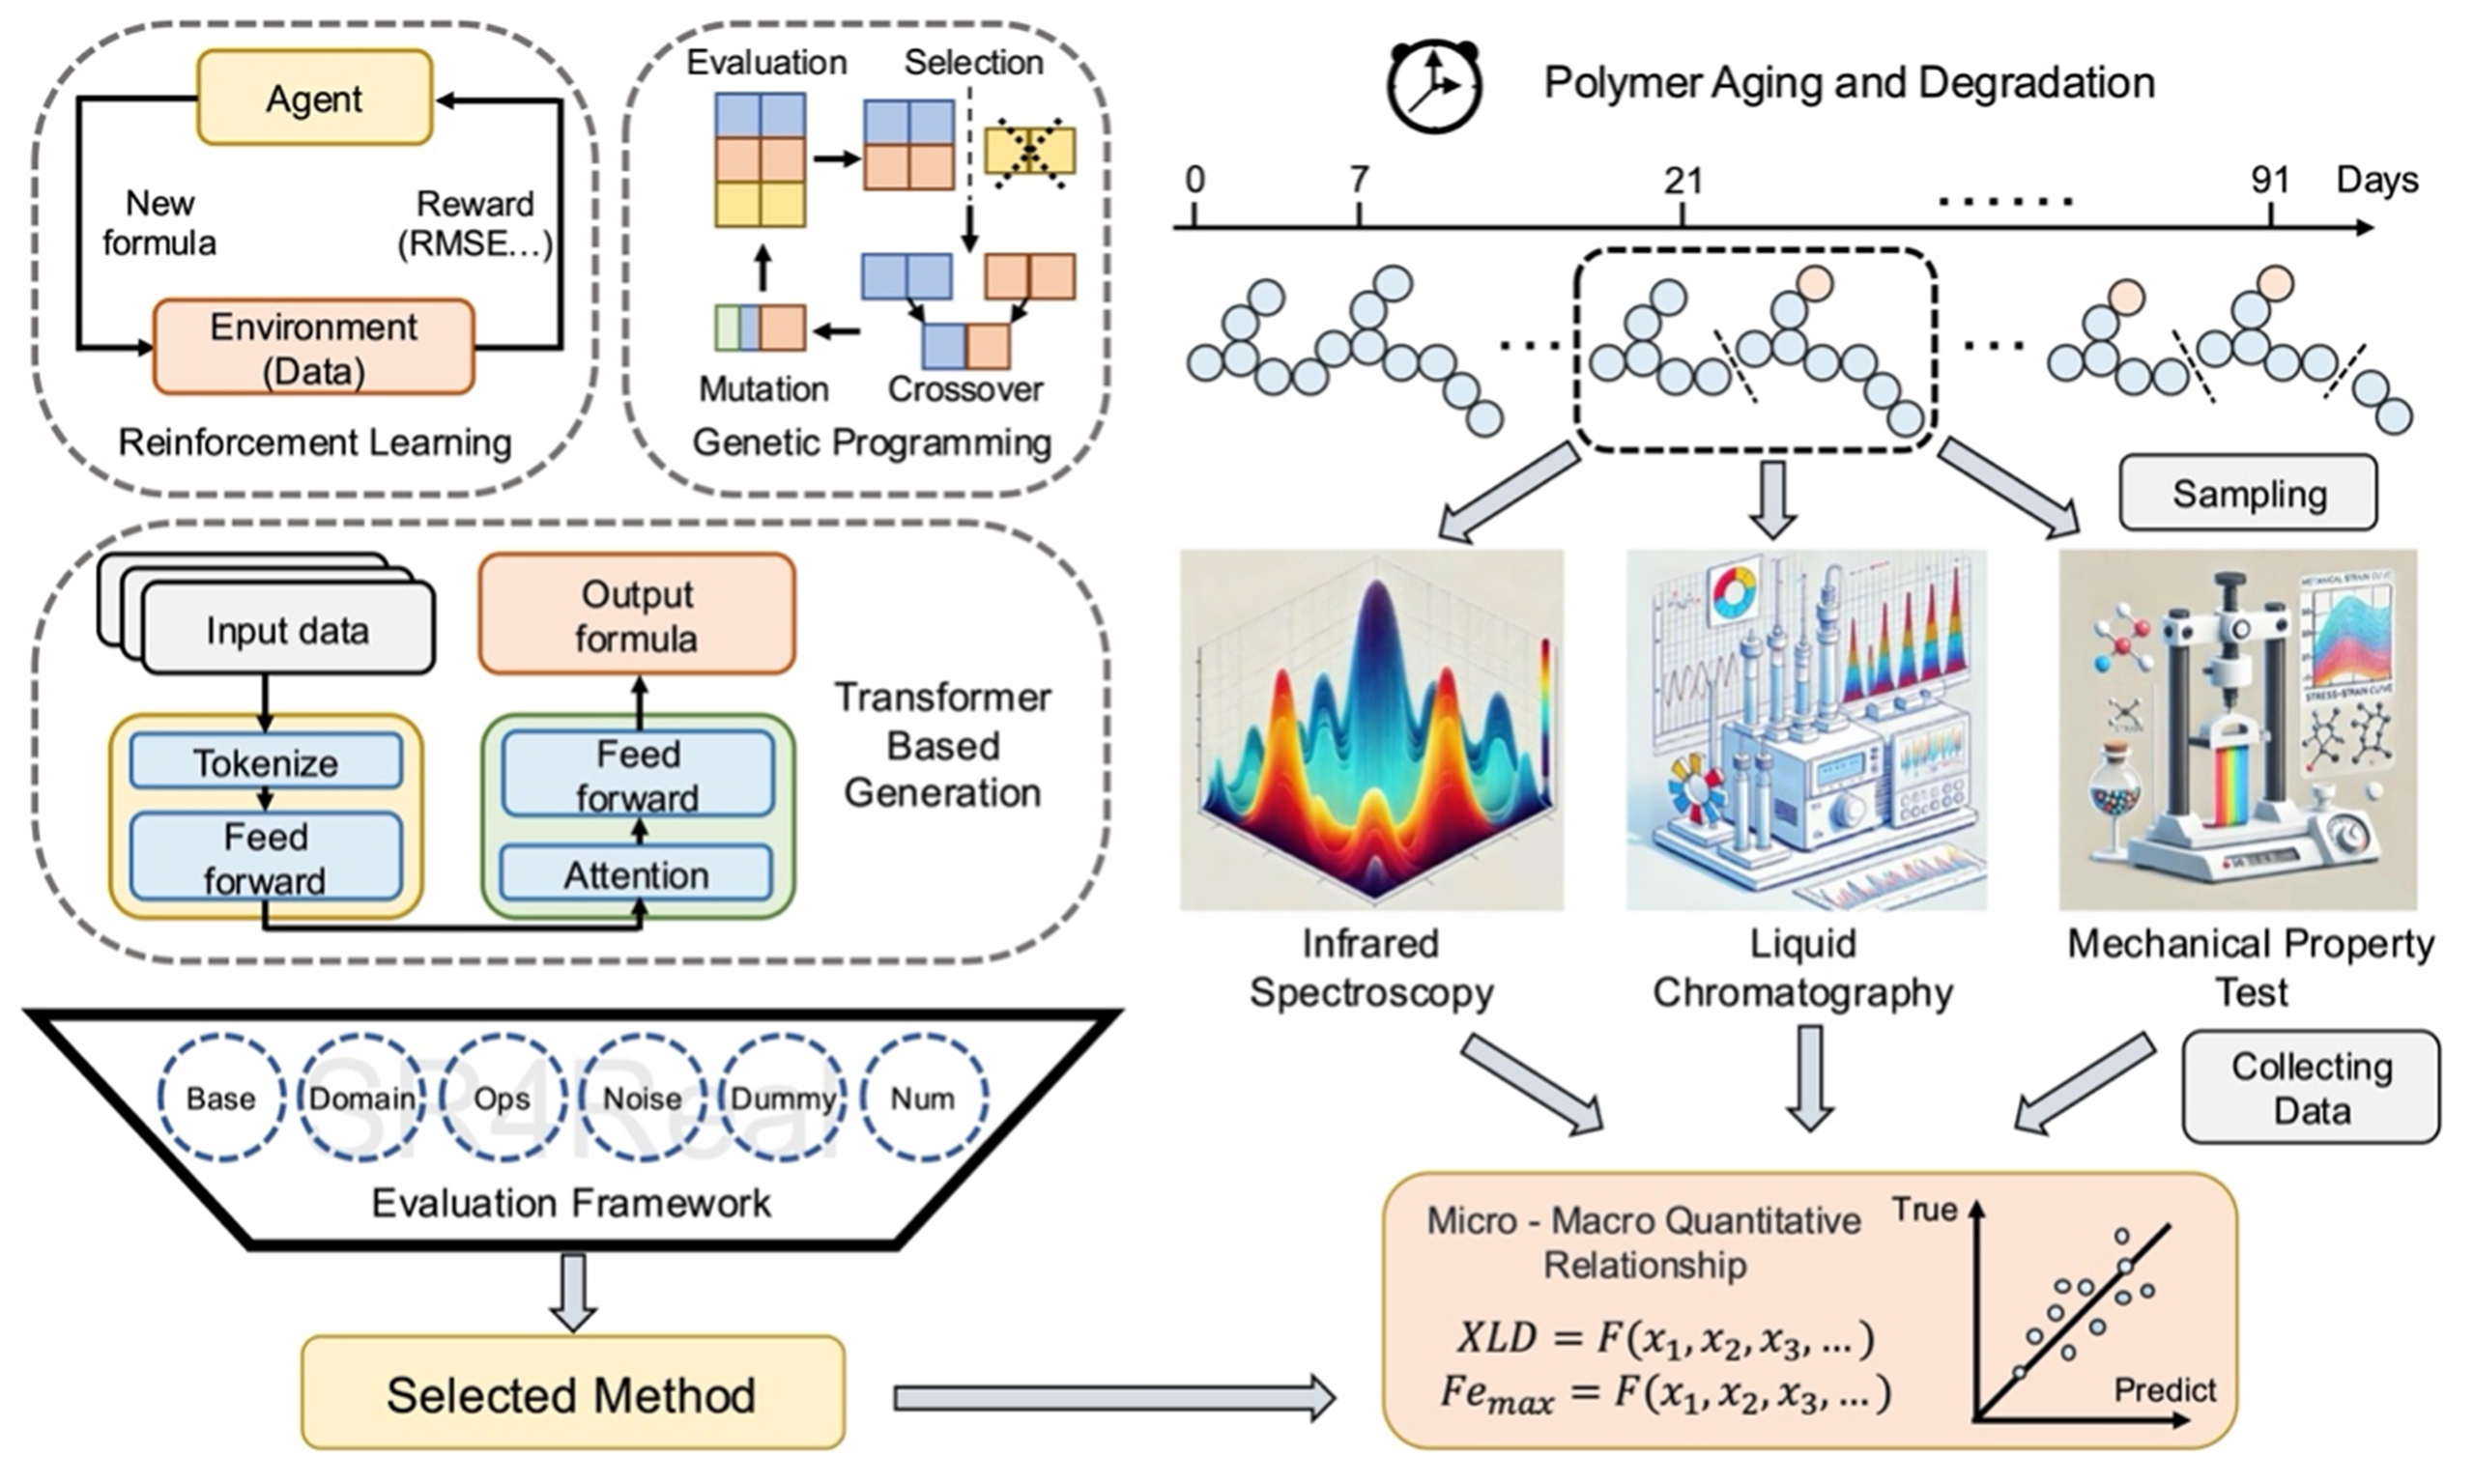
To address the issues regarding SR evaluation, this paper proposes the SR4Real evaluation framework, a more comprehensive SR evaluation framework. It aims to screen out superior SR methods for aging experimental data. The overall workflow is illustrated in Figure 1. The following are the components of the workflow.

Figure 1. The overall workflow of discovering the aging quantitative relationships of polymer materials through SR. (A) Diverse candidate SR algorithms, such as those based on reinforcement learning, genetic algorithms and transformer architecture; (B) Evaluation framework based on SR4Real dataset considering formulas with six characteristics: Base, Ops, Domain, Num, Noise and Dummy; (C) Aging material samples from aging experiments; (D) Aging sample characterization data from characterization experiments. (The schematic diagrams are generated by GPT4o); (E) The discovery of the internal relationships in the aging characterization data based on the selected SR method. SR: Symbolic regression.
SR4Real benchmark
We follow the dataset partitioning given by Matsubara et al., selecting ten simple formulas, six formulas with more operations, and six formulas with large data value ranges[43]. Each formula contains 1,000 data points corresponding to the fully fitted equations. Additionally, subsets with fifty data points per formula, noise levels of 0.1, and unrelated variables are generated based on ten equations in simple formulas. For detailed information on the establishment process of the SR4Real dataset, refer to the “Data construction details” section in the Supplementary Materials. This results in six types of datasets, each testing SR under various conditions. They are denoted by the following symbols.
• Base: represents basic complexity, containing ten formulas.
• Noise: includes datasets characterized by the presence of noise.
• Num: involves datasets with sparse data.
• Domain: features datasets that span a wide range of values and contain six formulas.
• Ops: consists of datasets with complex ground truth formulas, comprising six formulas.
• Dummy: includes datasets with irrelevant variables.
The characteristics of the dataset are presented as shown in Table 1. The specific formula form can be referred to in Supplementary Tables 1-3.
The characteristics of the SR4Real dataset
| Type | Number of equations | Number of data | Operation range | Domain range | Perfect fit | Dummy variable |
| Base | 10 | 1,000 | (2,5) | (2,12) | Yes | No |
| Ops | 6 | 1,000 | (8,15) | (2,6) | Yes | No |
| Domain | 6 | 1,000 | (4,7) | (30,50) | Yes | No |
| Num | 10 | 50 | (2,5) | (2,12) | Yes | No |
| Noise | 10 | 1,000 | (2,5) | (2,12) | No | No |
| Dummy | 10 | 1,000 | (2,5) | (1,4) | Yes | Yes |
Rubber aging experimental dataset
The aging experiment dataset comes from the thermal-oxidative aging of polybutadiene rubber dumbbell-shaped tensile specimens, including experimental characterization data of materials subjected to six different aging durations (7, 21, 37, 51, 72, and 91 days), three different temperatures (50, 60, and 70 °C), and three different strain conditions (5%, 10%, and 15%). Including one unaged sample, the dataset contains a total of 37 samples. The following characterizations are performed on these 37 samples:
1. Use attenuated total reflection-Fourier transform infrared spectroscopy (ATR-FTIR) to determine the infrared spectrum of the rubber surface and cross-section to observe the changes in chemical structure during aging.
2. Use low-field NMR (LF-NMR) to determine the changes in crosslink density (XLD) of rubber during thermal oxidative aging.
3. Use liquid chromatography to determine the changes in the content of plasticizers and antioxidants in rubber.
4. Use a hardness tester to measure the changes in the surface hardness of the rubber.
5. Use an electronic universal testing machine to determine the tensile properties of rubber and obtain the variation of the fracture elongation (Fe).
Each data point in the dataset includes 11 features: four characteristic peaks on the material surface and four on the material cross-section, identified via IR; the XLD of the polymer measured by LF-NMR; and the content of plasticizers and antioxidants directly quantified through liquid chromatography.
Additionally, each data point contains two dependent variables, both macroscopic properties related to the material’s mechanical performance: elongation at fracture and Shore hardness. These properties provide insight into the material’s behavior under stress and its overall hardness. The symbolic definitions of the variables are presented in Table 2.
The symbolic definitions of variables in aging experimental data
| Property | IR 2,914 cm-1 (S) | IR 2,840 cm-1 (S) | IR 964 cm-1 (S) | IR 1,736 cm-1 (S) | IR 2,914 cm-1 (C) | IR 2,840 cm-1 (C) | IR 964 cm-1 (C) | IR 1,736 cm-1 (C) | XLD (mol/L) | Antioxidant content (mg/g) | Plasticizer content (mg/g) | Shore hardness (HA) | Elongation at fracture (%) |
| Variable name | ω1 | ω2 | ω3 | ω4 | v1 | v2 | v3 | v4 | XLD | LCa | LCp | Hardness | Fe |
In the context of this study, the materials investigated are polymer-based systems undergoing aging, which leads to chemical changes over time. Specifically, the aging process in these materials involves crosslinking reactions facilitated by the breaking of carbon-carbon (C=C) double bonds in the presence of oxygen, which alters both their molecular structure and mechanical properties.
For IR, different peaks correspond to the vibrational modes of various functional groups. The peaks at 2,914 and 2,840 cm-1 correspond to the stretching vibrations of C–H bonds, which indicate the presence of carbon atoms bonded to two hydrogen atoms. The peak at 1,736 cm-1 is attributed to the stretching vibration of C=O bonds, characteristic of compounds such as esters, and provides indirect information about the concentration of plasticizers in the system. The peak at 964 cm-1 is associated with the specific vibration of C=C double bonds, including the out-of-plane bending vibration of cis-C=C, offering insight into the remaining double-bond content, which is an important indicator of the material’s degree of crosslinking and oxidation.
LF-NMR spectroscopy is used to directly quantify the XLD, a crucial parameter that reflects the degree of polymer crosslinking within the material, influencing its mechanical properties.
Liquid chromatography is employed to directly measure the content of antioxidants and plasticizers in the sample. The presence of antioxidants (hindered phenol-type compounds) helps to mitigate oxidative degradation, while plasticizers (fatty esters and phthalate esters) are crucial in modifying the flexibility and hardness of the polymer.
Regarding mechanical properties, Fe is defined as the ratio of the material’s elongation at the point of fracture to its original length, typically expressed as a percentage. Shore hardness is a measure of the material’s surface hardness, determined using a Shore hardness tester. These mechanical properties provide valuable insights into the material’s performance under different aging conditions and are key to understanding the relationship between molecular structure and macroscopic behavior. The distribution of all aging variables is shown in Supplementary Figure 1.
Baseline regression methods
Multiple linear regression
Multiple linear regression (MLR) posits the existence of a linear relationship between independent variables (features) and a dependent variable (target). Typically, it is represented as a linear combination of features plus an intercept term, optimized by minimizing a loss function - such as the sum of squared residuals.
Support vector machine regression
Support vector machine regression (SVR) extends the principles of support vector machines to handle continuous target variables. SVR aims to identify a function that deviates from the true outputs by no more than a pre-specified tolerance, while minimizing the overall model complexity. The framework relies on kernel functions to efficiently capture nonlinear relationships by mapping inputs into a higher-dimensional space.
Random forest
Random forest (RF) is an ensemble learning method that integrates multiple decision trees for regression or classification tasks. Each tree is trained on a bootstrap sample from the original dataset, and at each split, only a randomly selected subset of features is considered.
Extreme gradient boosting
Extreme gradient boosting (XGBoost) is a powerful ensemble technique built upon the principles of gradient boosting. It incrementally constructs an ensemble of weak learners, usually decision trees, where each new tree attempts to correct the residual errors of the previously combined models.
SR algorithm
We select three SR methods as our candidate approaches. These methods cover typical algorithms in SR, such as the Transformer model architecture, reinforcement learning, and genetic algorithms, which are representative among numerous SR algorithms.
E2E
The E2E algorithm is designed to directly predict the full mathematical expression, including constants. It leverages a Transformer-based architecture and directly decodes the hidden formula behind the data through the input data. The advantage of this method is that it can pre-train the Transformer model, establishing the mapping relationship between the input data and the output formula in advance, and then directly predict in downstream tasks. However, it is prone to the problem of poor generalization ability.
Deep symbolic optimization
Deep symbolic optimization (DSO) uses recursive neural networks to generate symbolic expressions, optimizing them based on the error between the expression and the data and using a reward strategy to stabilize training. The reinforcement learning iterative process in DSO is shown in the Reinforcement Learning section of Figure 1A.
uDSR
uDSR combines multiple SR-solving strategies for better performance, including recursive problem simplification, neural-guided search, and GP. The uDSR algorithm first breaks down the problem of the explosive combination of variables and operators into multiple low-dimensional subproblems, then uses reinforcement learning to generate an initial population (Reinforcement Learning section of Figure 1A), and finally uses a genetic algorithm for the evolution of the population to obtain more general formulas (Genetic Programming section of Figure 1A).
Evaluation metric
SR4Real dataset evaluation metric
We use both the coefficient of determination (R2) score on the test set and the normalized edit distance (NED) measure as evaluation metrics for the SR4Real benchmark. Here, R2 reflects how well the predicted formula fits the test data, as expressed by
Where yi denotes true (observed) value of the dependent variable for the i-th data point.
NED represents the distance between the predicted and the ground-truth formulas, as given in
Where P denotes the predicted formula, represented as a sequence of tokens (e.g., variables, operators, and constants). T is the ground-truth formula, represented as a sequence of tokens. |P| represents the lengths (in terms of the number of tokens) of the predicted formula P. ED (P, T) is the edit distance between P and T, typically computed as the minimum number of insertions, deletions, or substitutions needed to transform P into T.
Aging experimental dataset evaluation metric
Since we do not know the true relationship between the inputs and outputs of the rubber aging experimental data, we choose mean absolute error (MAE) and root mean square error (RMSE) as the evaluation metrics, as given in
Where yi denotes true (observed) value of the dependent variable for the i-th data point.
RESULTS AND DISCUSSION
SR method performance on SR4Real dataset
We evaluate the performance of three distinct SR algorithms: E2E, DSO, uDSR, across six diverse datasets: base, noise, number, domain, ops, and dummy. The algorithms are assessed using two metrics: R2 and NED. The NED measures the structural similarity between two symbolic expressions by calculating the minimum number of editing operations - insertions, deletions, and substitutions - required to transform a predicted equation into the correct one. The experimental details of SR4Real can be found in the “Experiment details” section of the Supplementary Materials. Comprehensive experimental results are presented in Figure 2, Tables 3 and 4.

Figure 2. The performance of three SR methods, namely E2E, DSO, and uDSR, on six datasets. (A) R2, (B)
The R2 score of each SR method on SR4Real dataset
| SR algorithm | E2E | DSO | uDSR |
| Base | 0.880 | 1.000 | 1.000 |
| Ops | 0.129 | 0.617 | 0.901 |
| Dummy | 0.944 | 0.880 | 0.999 |
| Noise | -0.115 | 0.647 | 0.643 |
| Num | 0.833 | 1.000 | 1.000 |
| Domain | 0.476 | 0.732 | 0.398 |
| Average | 0.525 | 0.813 | 0.824 |
The NED of each SR method on SR4Real dataset
| SR algorithm | E2E | DSO | uDSR |
| Base | 65.500 | 3.300 | 10.500 |
| Ops | 205.500 | 15.833 | 132.333 |
| Dummy | 269.400 | 17.000 | 26.700 |
| Noise | 74.600 | 16.400 | 70.700 |
| Num | 48.400 | 4.600 | 12.000 |
| Domain | 132.667 | 10.167 | 17.667 |
| Average | 132.678 | 11.217 | 44.983 |
In the base scenario, algorithms such as DSO and uDSR display remarkable performance, with E2E also having a moderate showing. Upon entering the few-sample (num) scenario, DSO and uDSR sustain their superiority and adapt well to limited data, in contrast to the relatively weaker E2E. In the presence of noisy data (noise), E2E suffers a significant performance decline, whereas DSO and uDSR, though affected, maintain a certain degree of efficacy. In the scenario with an irrelevant variable (Dummy), uDSR excels, and E2E and DSO remain relatively stable. For the scenario involving a large number of formula operands (ops), uDSR outperforms, while E2E lags behind. In the domain with a wide data threshold range, DSO shows greater adaptability, and E2E and uDSR perform moderately. Overall, DSO and uDSR exhibit enhanced adaptability and performance across diverse complex scenarios, while E2E is susceptible to performance fluctuations and reductions in certain complex settings. We conduct quantitative experiments under the Num Noise Dummy conditions, the details and results of which are presented in the “Quantitative experiments under the Num, Noise, and Dummy conditions in SR4Real” section of the Supplementary Materials and Supplementary Figure 2. Additionally, we evaluate the approximate computational time overhead of SR4Real, the results of which are presented in the “Computational time overhead of SR4Real” section of the Supplementary Materials and Supplementary Table 6.
In the evaluation of NED, DSO is significantly superior to E2E and uDSR, with the smallest average NED value, indicating that when considering a comprehensive range of situations, DSO has the lowest average deviation from the true formula. In the ops scenario with a large number of formula operands, DSO performs excellently. In contrast, E2E has a relatively large NED value. DSO can more effectively handle complex formula structures to approach the true formula. In the noise scenario where the data contains noise, DSO demonstrates outstanding noise resistance. Its NED value is much lower than that of E2E and uDSR, which strongly proves that DSO can still maintain a relatively close distance to the true formula under noise interference, with its stability and accuracy being well manifested. Our discussion of the phenomenon that DSO is slightly less accurate than uDSR but NED significantly outperforms uDSR is discussed in the “Discussion of Performance Difference Between Different Symbolic Regression Methods” section of the Supplementary Materials.
Therefore, we believe that DSO has a better average performance in scenarios with various data characteristics, including fitting accuracy and the authenticity of the regression formula, and thus has the potential for application in experimental datasets.
SR method performance on aging experimental dataset
Due to the subpar performance of the E2E method on the SR4Real dataset, we select the top two SR methods, DSO and uDSR, to conduct verification on the experimental data of material aging. To evaluate the advantages of SR, we compare it with four methods: linear regression based on variable screening, SVR, RF, and XGBoost. The selection of linear regression based on variable screening is because we aim to compare the performance differences between the linear regression with variable screening involving expert knowledge and SR. Hence, we perform a SHapley Additive exPlanations (SHAP) analysis on the experimental data of rubber aging, and the results are shown in Figure 3. Furthermore, RF, SVR, and XGBoost are included because, despite SR’s advantages in producing interpretable expressions, this study seeks to assess the accuracy differences between SR and machine learning regression methods that are suitable for small-sample datasets. We add more experimental results of regression models in the “Additional Regression Method Details and Results” section of the Supplementary Materialss and Supplementary Tables 7 and 8.

Figure 3. The feature importance screening results obtained through SHAP analysis with (A) Shore hardness and (B) fracture elongation as the dependent variables, respectively. SHAP: SHapley Additive exPlanations.
A total of eleven variables are subjected to SHAP analysis, resulting in two sets of results. Horizontally, samples numbered from 0 to 36 are presented. Each feature of every sample will have a SHAP value, and finally, the importance of each feature is obtained by averaging the Shapley values of each sample.
It can be seen from Figure 3 that the feature importance of XLD, antioxidant content and plasticizer content is significant. This phenomenon is also consistent with the order of the correlation magnitudes between these three features and Shore hardness in the correlation analysis. This will be elaborated on in the final discussion section.
We selected the top four features with the largest SHAP values to conduct MLR on the aging experimental data. Meanwhile, we also carried out verification of the SVR, RF, XGboost, DSO, and uDSR methods on the aging data. We employed Shore hardness and Fe as dependent variables. The obtained results are shown in Tables 5 and 6. Detailed results can be found in Supplementary Tables 4 and 5.
Prediction performance of six regression methods on the test set with Shore hardness as the dependent variable
| Algorithm | Mean RMSE | Std RMSE | Mean MAE | Std MAE |
| MLR | 2.690 | 0.677 | 2.189 | 0.935 |
| SVR | 2.890 | 1.360 | 2.547 | 1.118 |
| RF | 3.038 | 1.324 | 2.481 | 0.972 |
| XGBoost | 3.326 | 1.449 | 2.687 | 1.039 |
| DSO | 2.253 | 1.043 | 1.814 | 0.848 |
| uDSR | 2.441 | 1.128 | 1.771 | 0.534 |
Prediction performance of six regression methods on the test set with fracture elongation as the dependent variable
| Algorithm | Mean RMSE | Std RMSE | Mean MAE | Std MAE |
| MLR | 0.076 | 0.01 | 0.055 | 0.007 |
| SVR | 0.071 | 0.007 | 0.063 | 0.006 |
| RF | 0.072 | 0.005 | 0.058 | 0.006 |
| XGBoost | 0.073 | 0.006 | 0.057 | 0.004 |
| DSO | 0.061 | 0.006 | 0.050 | 0.004 |
| uDSR | 0.066 | 0.009 | 0.053 | 0.007 |
In the regression task with the hardness and Fe as dependent variables, DSO performs the best, with the lowest RMSE on the test set, demonstrating its significant advantage in capturing the complex relationships between input and output variables. In contrast, traditional regression models (such as MLR, SVR, RF, and XGBoost) generally performed poorly, struggling to effectively model the nonlinear relationships between micro and macro properties.
We further present the fitting results of the six aforementioned methods under the third cross-validation split for Hardness and the first cross-validation split for Fe, as shown in Figures 4 and 5. We also provide the residual plots of different regression methods in five-fold cross-validation in Supplementary Figures 3 and 4.

Figure 4. Performance of six regression methods on the test and training sets for Shore hardness.

Figure 5. Performance of six regression methods on the test and training sets for fracture elongation.
Although both RF and XGBoost fit the data in the training set better, they do not perform well in the test set, which suggests that a certain degree of overfitting occurs and that choosing a model with stronger fitting ability does not result in a generalized model, whereas the DSO method has the best test set performance. Our experiments on Table 4 SR4Real also demonstrate the stabilizing ability of DSO to uncover formulas in various complex cases, which is consistent with the current experimental results.
Analysis of the chemical significance of the formula
We considered three methods that provide explicit expressions: MLR, DSO, and uDSR. The formulas are presented in Tables 7 and 8, respectively.
The formula obtained for MLR, DSO, and uDSR under the hardness task
| Algorithm | Formula |
| MLR | Hardness = 26.775·ω1 + 6.505·μ3 + 11.397·XLD - 20.073·LCa + 33.808 |
| DSO | Hardness = (27.154XLD + |
| uDSR | Hardness = XLD·exp (μ2 + 3.000) + XLD |
The formula obtained for MLR, DSO, and uDSR under the Fe task
| Algorithm | Formula |
| MLR | Fe = 0.347·ω1 - 1.820·ω2 - 0.233·XLD - 0.006·LCp + 1.748 |
| DSO | Fe = ω4 + |
| uDSR | Fe = exp (ω3 + (-μ2- ln(XLD) + 1.000)·exp (ω3·exp (μ3))) |
Based on chemical prior knowledge, the relationship between hardness and XLD is positive, while the relationship with the content of double bonds is negative. This is because the crosslinking process is accompanied by the opening of double bonds, and a higher content of double bonds indicates less crosslinking. Furthermore, the relationship between Fe and XLD is negative, while it is positive with plasticizer content.
We observe from the regression formula for Hardness in Table 7 that, in the formula obtained from DSO, the term (exp(μ3) - 0.641) can be treated as a constant, given that the range of μ3 is approximately 0 to 0.1. This approximation allows the second formula to align well with chemical prior knowledge. However, in the MLR model, the coefficient for the double-bond carbon is positive, which contradicts the chemical prior knowledge. This suggests that the relationship between the content of double bonds and hardness should not be modeled as linear.
From the regression formula of Fe presented in Table 8, it is noted that, in the formula acquired through DSO, the second term (-ω1·ω4·μ4·exp(-ω2) - ω2) is significantly smaller than the term (exp(exp(ω4))). As a result, the overall formula approximates a positive correlation with (ω4) and a negative correlation with XLD, which aligns well with chemical prior knowledge. However, in the MLR method, the coefficient for the directly measured plasticizer content is negative, which contradicts the chemical prior knowledge.
Based on this analysis, the regression formula derived from the DSO method for the aging experimental data holds practical chemical significance.
CONCLUSIONS
In this study, we have proposed a comprehensive evaluation framework for SR algorithms and demonstrated its application to the aging process of rubber materials. The primary goal was to explore and quantify the relationship between the microscopic characteristics and macroscopic properties of rubber materials during aging, leveraging the interpretability and flexibility of SR methods. Through rigorous validation and application of SR on experimental aging data, we have made several key findings that contribute to the understanding of material aging mechanisms and the potential of SR in material science.
We introduced a novel evaluation framework tailored to real-world experimental data, addressing challenges such as data sparsity, noise, and extraneous variables. Unlike traditional evaluation methods that rely on artificial datasets, our framework provides a more accurate and comprehensive assessment of SR algorithms, highlighting their practical applicability in complex, real-world scenarios. Our evaluation framework identified the SR methods that performed better on the experimental dataset. This framework ensures that the chosen SR methods are capable of uncovering meaningful relationships in material aging data, ultimately improving their usability in scientific research.
Through the SR approach, we revealed robust quantitative relationships between the microscopic features and macroscopic properties during the aging process of rubber materials. These relationships are further interpreted with chemical significance. They play a crucial role in predicting the service life of materials and provide a deeper understanding of the aging quantitative relationships that affect material performance. The discovered expressions also offer an intuitive framework for future research on aging prediction and material design.
Although this study has achieved certain results, there are several directions especially the following two major ones that are worth further exploration: (1) Expansion of Formula Diversity and Quantification: Future work can further quantitatively investigate the specific effects of different data scales, noise levels, and the number of irrelevant variables, in order to improve the evaluation framework of SR for real-world data; (2) Validation of More Aging Experimental Data: Due to the high cost of acquiring aging experimental data, the quantitative relationship between microscopic characteristics and macroscopic properties has not been fully validated in this study. Future work can further expand the dataset to enhance the accuracy and generalization ability of the model.
DECLARATIONS
Authors’ contributions
Made substantial contributions to conception and design of the study and performed data analysis and interpretation: Li, W.; Wang, Z.; Yang, R.; Wang, X.
Carried out all the tests of samples: Zhao, M.
Prepared samples and carried out aging experiments: Pei, J.; Hu, Y.
Performed data acquisition and provided administrative, technical, and material support: Yang, R.; Wang, X.
Availability of data and materials
Both the SR4Real benchmark data and the Aging experiment data, along with their corresponding codes, have been uploaded to the author’s GitHub repository, accessible at the following link: https://github.com/littlepeachs/SR4Aging.
Financial support and sponsorship
This work is supported by the National Key R&D Program of China (No. 2022ZD0117501).
Conflicts of interest
Wang, X. serves as an Editorial Board Member of Journal of Materials Informatics but was not involved in any aspect of the editorial process for this manuscript, including reviewer selection, manuscript handling, or decision-making. The remaining authors declare no conflicts of interest.
Ethical approval and consent to participate
Not applicable.
Consent for publication
Not applicable.
Copyright
© The Author(s) 2025.
Supplementary Materials
REFERENCES
1. Hao, J.; Wilkie, C. A.; Wang, J. An XPS investigation of thermal degradation and charring of cross-linked polyisoprene and polychloroprene. Polym. Degrad. Stab. 2001, 71, 305-15.
2. Wang, J.; Du, J.; Zhu, J.; Wilkie, C. A. An XPS study of the thermal degradation and flame retardant mechanism of polystyrene-clay nanocomposites. Polym. Degrad. Stab. 2002, 77, 249-52.
3. Moo-Tun, N. M.; Valadez-González, A.; Uribe-Calderon, J. A. Thermo-oxidative aging of low density polyethylene blown films in presence of cellulose nanocrystals and a pro-oxidant additive. Polym. Bull. 2018, 75, 3149-69.
4. Cai, G.; Zhang, D.; Jiang, D.; Dong, Z. Degradation of fluorinated polyurethane coating under UVA and salt spray. Part II: Molecular structures and depth profile. Prog. Org. Coat. 2018, 124, 25-32.
5. Goliszek, M.; Podkościelna, B.; Sevastyanova, O.; Fila, K.; Chabros, A.; Pączkowski, P. Investigation of accelerated aging of lignin-containing polymer materials. Int. J. Biol. Macromol. 2019, 123, 910-22.
6. Zuo, P.; Tcharkhtchi, A.; Shirinbayan, M.; Fitoussi, J.; Bakir, F. Multiscale physicochemical characterization of a short glass fiber–reinforced polyphenylene sulfide composite under aging and its thermo-oxidative mechanism. Polym. Adv. Technol. 2019, 30, 584-97.
7. Tripathy, S. P.; Mishra, R.; Dwivedi, K. K.; Khathing, D. T.; Ghosh, S.; Fink, D. Degradation in polytetrafluoro ethylene by 62 mev protons. Radiat. Eff. Defects. Solids. 2002, 157, 303-10.
8. Khanna, N. D.; Kaur, I.; Bhalla, T. C.; Gautam, N. Effect of biodegradation on thermal and crystalline behavior of polypropylene–gelatin based copolymers. J. Appl. Polym. Sci. 2010, 118, 1476-88.
9. Nouh, S. A.; Mohamed, A.; El Hussieny, H. M.; Hegazy, T. M. Modification induced by alpha particle irradiationin Makrofol polycarbonate. J. Appl. Polym. Sci. 2008, 109, 3447-51.
10. Lei, Z.; Bliesner, S. E.; Mattson, C. N.; et al. Aerosol acidity sensing via polymer degradation. Anal. Chem. 2020, 92, 6502-11.
11. Gu, X.; Raghavan, D.; Nguyen, T.; Vanlandingham, M.; Yebassa, D. Characterization of polyester degradation using tapping mode atomic force microscopy: exposure to alkaline solution at room temperature. Polym. Degrad. Stab. 2001, 74, 139-49.
12. Park, B.; Jeong, H. Effects of acid hydrolysis on microstructure of cured urea-formaldehyde resins using atomic force microscopy. J. Appl. Polym. Sci. 2011, 122, 3255-62.
13. Mouaci, S.; Saidi, M.; Saidi-Amroun, N. Oxidative degradation and morphological properties of gamma-irradiated isotactic polypropylene films. Micro. Nano. Lett. 2017, 12, 478-81.
14. Moudoud, M.; Hedir, A.; Lamrous, O.; Diaham, S.; Touam, T. Physical ageing of insulating polystyrene from dielectric properties measurements and structural analysis. Mater. Res. Express. 2019, 6, 095324.
15. Saba, N.; Jawaid, M.; Alothman, O. Y.; Paridah, M. A review on dynamic mechanical properties of natural fibre reinforced polymer composites. Constr. Build. Mater. 2016, 106, 149-59.
16. Hu, X.; Luo, W.; Liu, X.; Li, M.; Huang, Y.; Bu, J. Temperature and frequency dependent rheological behaviour of carbon black filled natural rubber. Plast. Rubber. Compos. 2013, 42, 416-20.
17. Al-itry, R.; Lamnawar, K.; Maazouz, A. Improvement of thermal stability, rheological and mechanical properties of PLA, PBAT and their blends by reactive extrusion with functionalized epoxy. Polym. Degrad. Stab. 2012, 97, 1898-914.
18. Shimamura, H.; Nakamura, T. Mechanical properties degradation of polyimide films irradiated by atomic oxygen. Polym. Degrad. Stab. 2009, 94, 1389-96.
19. Starkova, O.; Gagani, A. I.; Karl, C. W.; Rocha, I. B. C. M.; Burlakovs, J.; Krauklis, A. E. Modelling of environmental ageing of polymers and polymer composites-durability prediction methods. Polymers 2022, 14, 907.
20. Plota, A.; Masek, A. Lifetime prediction methods for degradable polymeric materials - a short review. Materials 2020, 13, 4507.
21. Zhang, X.; Wu, Y.; Chen, X.; Wen, H.; Xiao, S. Theoretical study on decomposition mechanism of insulating epoxy resin cured by anhydride. Polymers 2017, 9, 341.
22. Ismail, A. E.; Pierce, F.; Grest, G. S. Diffusion of small penetrant molecules in polybutadienes. Mol. Phys. 2011, 109, 2025-33.
23. Vuković, F.; Walsh, T. R. Moisture ingress at the molecular scale in hygrothermal aging of fiber-epoxy interfaces. ACS. Appl. Mater. Interfaces. 2020, 12, 55278-89.
24. Meng, X.; Ye, Y.; Yang, R. Computational and experimental study on the mechanism of CO2 production during photo-oxidative degradation of poly(butylene adipate-co-terephthalate): differences between PBA and PBT segments. Macromolecules 2023, 56, 7749-62.
25. Doblies, A.; Boll, B.; Fiedler, B. Prediction of thermal exposure and mechanical behavior of epoxy resin using artificial neural networks and fourier transform infrared spectroscopy. Polymers 2019, 11, 363.
26. Yuan, W.; Hibi, Y.; Tamura, R.; et al. Revealing factors influencing polymer degradation with rank-based machine learning. Patterns 2023, 4, 100846.
27. Larché, J.; Bussière, P.; Thérias, S.; Gardette, J. Photooxidation of polymers: relating material properties to chemical changes. Polym. Degrad. Stab. 2012, 97, 25-34.
28. Li, X.; Zhao, X.; Ye, L. Stress photo-oxidative aging behaviour of polyamide 6. Polym. Int. 2012, 61, 118-23.
29. Pourmand, P.; Hedenqvist, M.; Furó, I.; Gedde, U. Deterioration of highly filled EPDM rubber by thermal ageing in air: kinetics and non-destructive monitoring. Polym. Test. 2017, 64, 267-76.
30. Neffe, A. T.; Tronci, G.; Alteheld, A.; Lendlein, A. Controlled change of mechanical properties during hydrolytic degradation of polyester urethane networks. Macromol. Chem. Phys. 2010, 211, 182-94.
31. Kaiser, E.; Kutz, J. N.; Brunton, S. L. Sparse identification of nonlinear dynamics for model predictive control in the low-data limit. Proc. Math. Phys. Eng. Sci. 2018, 474, 20180335.
32. Schmidt, M.; Lipson, H. Distilling free-form natural laws from experimental data. Science 2009, 324, 81-5.
33. Kamienny, P. A.; d’Ascoli, S.; Lample, G.; Charton, F. End-to-end symbolic regression with transformers. arXiv2022, arXiv:2204.10532. Available online: https://doi.org/10.48550/arXiv.2204.10532. (accessed on 21 Mar 2025)
34. Valipour, M.; You, B.; Panju, M.; Ghodsi, A. SymbolicGPT: a generative transformer model for symbolic regression. arXiv2021, arXiv:2106.14131. Available online: https://doi.org/10.48550/arXiv.2106.14131. (accessed on 21 Mar 2025)
35. Udrescu, S. M.; Tegmark, M. AI Feynman: a physics-inspired method for symbolic regression. Sci. Adv. 2020, 6, eaay2631.
36. Petersen, B. K.; Landajuela, M.; Mundhenk, T. N.; Santiago, C. P.; Kim, S. K.; Kim, J. T. Deep symbolic regression: recovering mathematical expressions from data via risk-seeking policy gradients. arXiv2019, arXiv:1912.04871. Available online: https://doi.org/10.48550/arXiv.1912.04871. (accessed on 21 Mar 2025)
37. Landajuela, M.; Lee, C. S.; Yang, J.; et al. A unified framework for deep symbolic regression. In: Proceedings of the 36nd International Conference on Neural Information Processing Systems, New Orleans, United States of America. 2022. Available from: https://proceedings.neurips.cc/paper_files/paper/2022/file/dbca58f35bddc6e4003b2dd80e42f838-Paper-Conference.pdf. (accessed on 2025-03-21)
38. La Cava, W.; Orzechowski, P.; Burlacu, B.; et al. Contemporary symbolic regression methods and their relative performance. arXiv2021, arXiv:2107.14351. Available online: https://doi.org/10.48550/arXiv.2107.14351. (accessed on 21 Mar 2025)
39. Wang, Y.; Wagner, N.; Rondinelli, J. M. Symbolic regression in materials science. MRS. Commun. 2019, 9, 793-805.
40. He, M.; Zhang, L. Machine learning and symbolic regression investigation on stability of MXene materials. Comput. Mater. Sci. 2021, 196, 110578.
41. Abdusalamov, R.; Hillgärtner, M.; Itskov, M. Automatic generation of interpretable hyperelastic material models by symbolic regression. Numer. Methods. Eng. 2023, 124, 2093-104.
42. Wang, S.; Jiang, J. Interpretable catalysis models using machine learning with spectroscopic descriptors. ACS. Catal. 2023, 13, 7428-36.
43. Matsubara, Y.; Chiba, N.; Igarashi, R.; Ushiku, Y. Rethinking symbolic regression datasets and benchmarks for scientific discovery. arXiv2022, arXiv:2206.10540. Available online: https://doi.org/10.48550/arXiv.2206.10540. (accessed on 21 Mar 2025)
Cite This Article
 , ... Xiaonan Wang
How to Cite
Li, W.; Wang, Z.; Zhao, M.; Pei, J.; Hu, Y.; Yang, R.; Wang, X. Symbolic regression accelerates the discovery of quantitative relationships in rubber material aging. J. Mater. Inf. 2025, 5, 29. http://dx.doi.org/10.20517/jmi.2024.103
Download Citation
Export Citation File:
Type of Import
Tips on Downloading Citation
Citation Manager File Format
Type of Import
Direct Import: When the Direct Import option is selected (the default state), a dialogue box will give you the option to Save or Open the downloaded citation data. Choosing Open will either launch your citation manager or give you a choice of applications with which to use the metadata. The Save option saves the file locally for later use.
Indirect Import: When the Indirect Import option is selected, the metadata is displayed and may be copied and pasted as needed.
About This Article
Special Issue
Copyright

Data & Comments
Data
0


Comments
Comments must be written in English. Spam, offensive content, impersonation, and private information will not be permitted. If any comment is reported and identified as inappropriate content by OAE staff, the comment will be removed without notice. If you have any queries or need any help, please contact us at [email protected].