

fig5
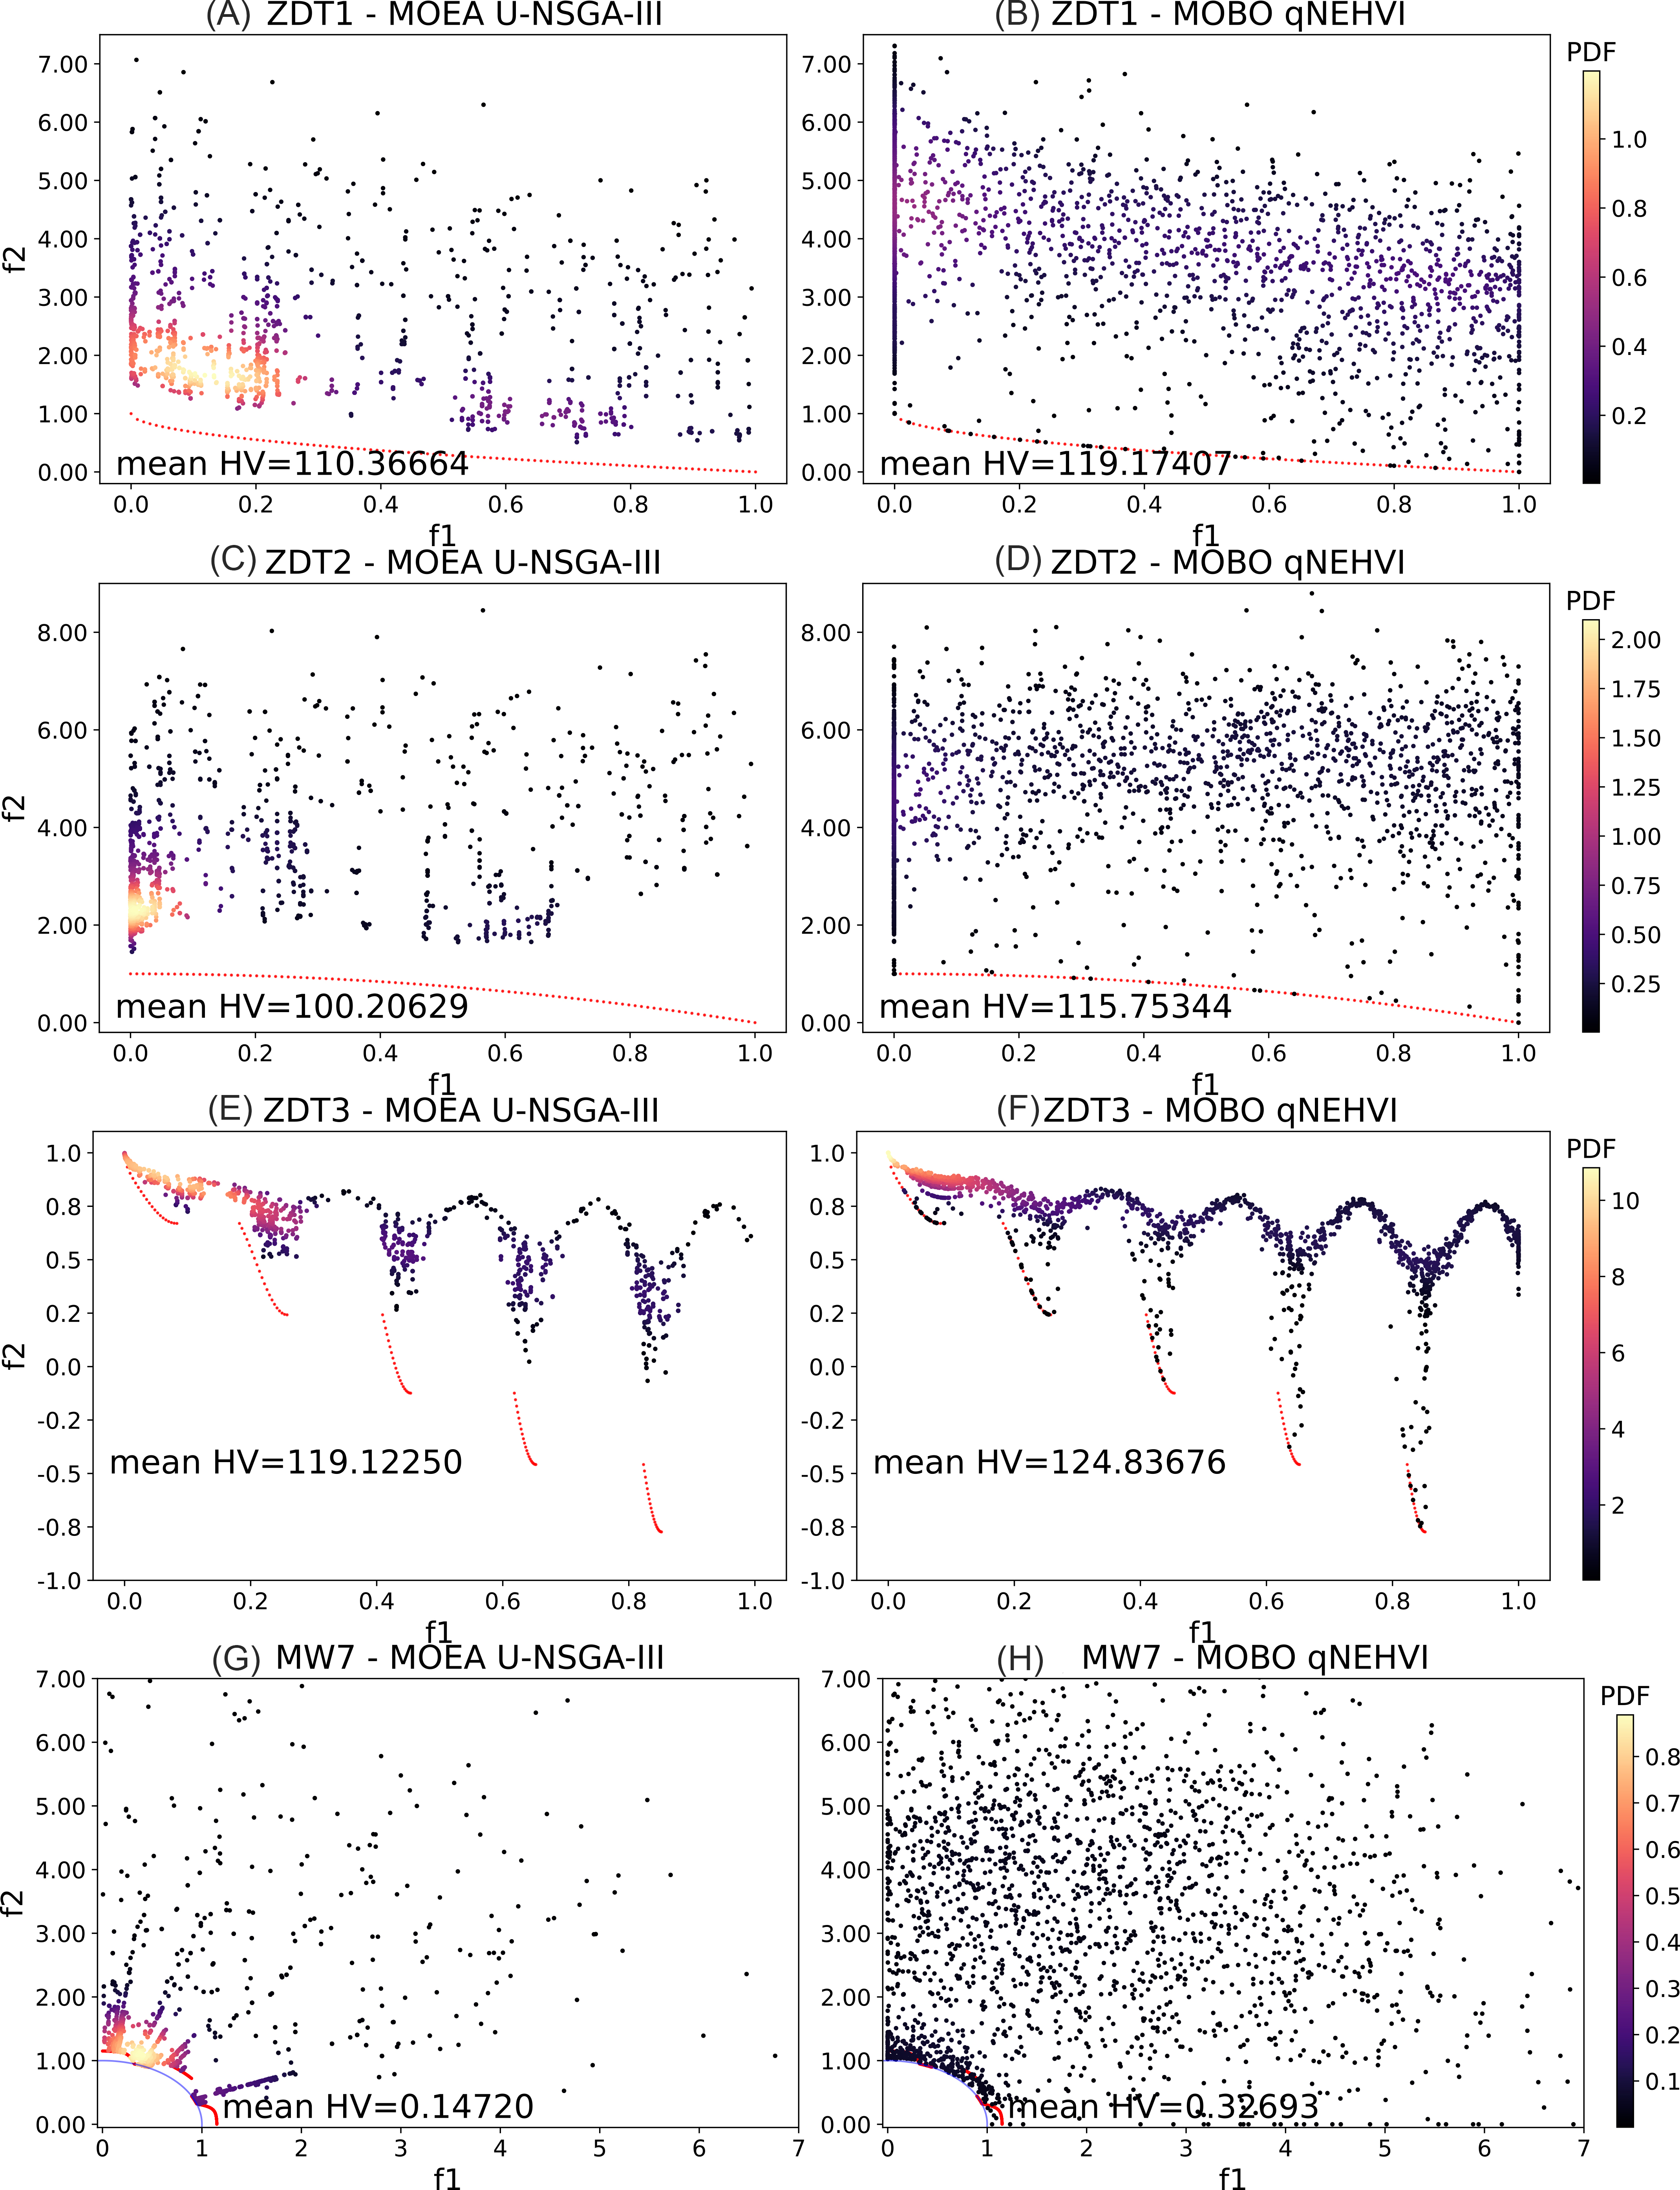
Figure 5. Probability density maps in objective space for 10 runs of 24 iterations × 8 points per batch. (A and B) ZDT1; (C and D) ZDT2; (E and F) ZDT3; (G and H) MW7. The evaluated data points are plotted with a Gaussian kernel density estimate using SciPy to illustrate the distribution of points across objective space. The color bar represents the numerical value of probability density. Results are averaged over the 10 runs and highlight the lower diversity of points and consistency in optimization trajectory for qNEHVI compared to U-NSGA-III. HV: hypervolume; MOBO: multi-objective Bayesian optimization; MOEA: multi-objective evolutionary algorithms; qNEHVI: q-Noisy Expected Hypervolume Improvement; U-NSGA-III: Unified Non-dominated Sorting Genetic Algorithm III.


