


fig3
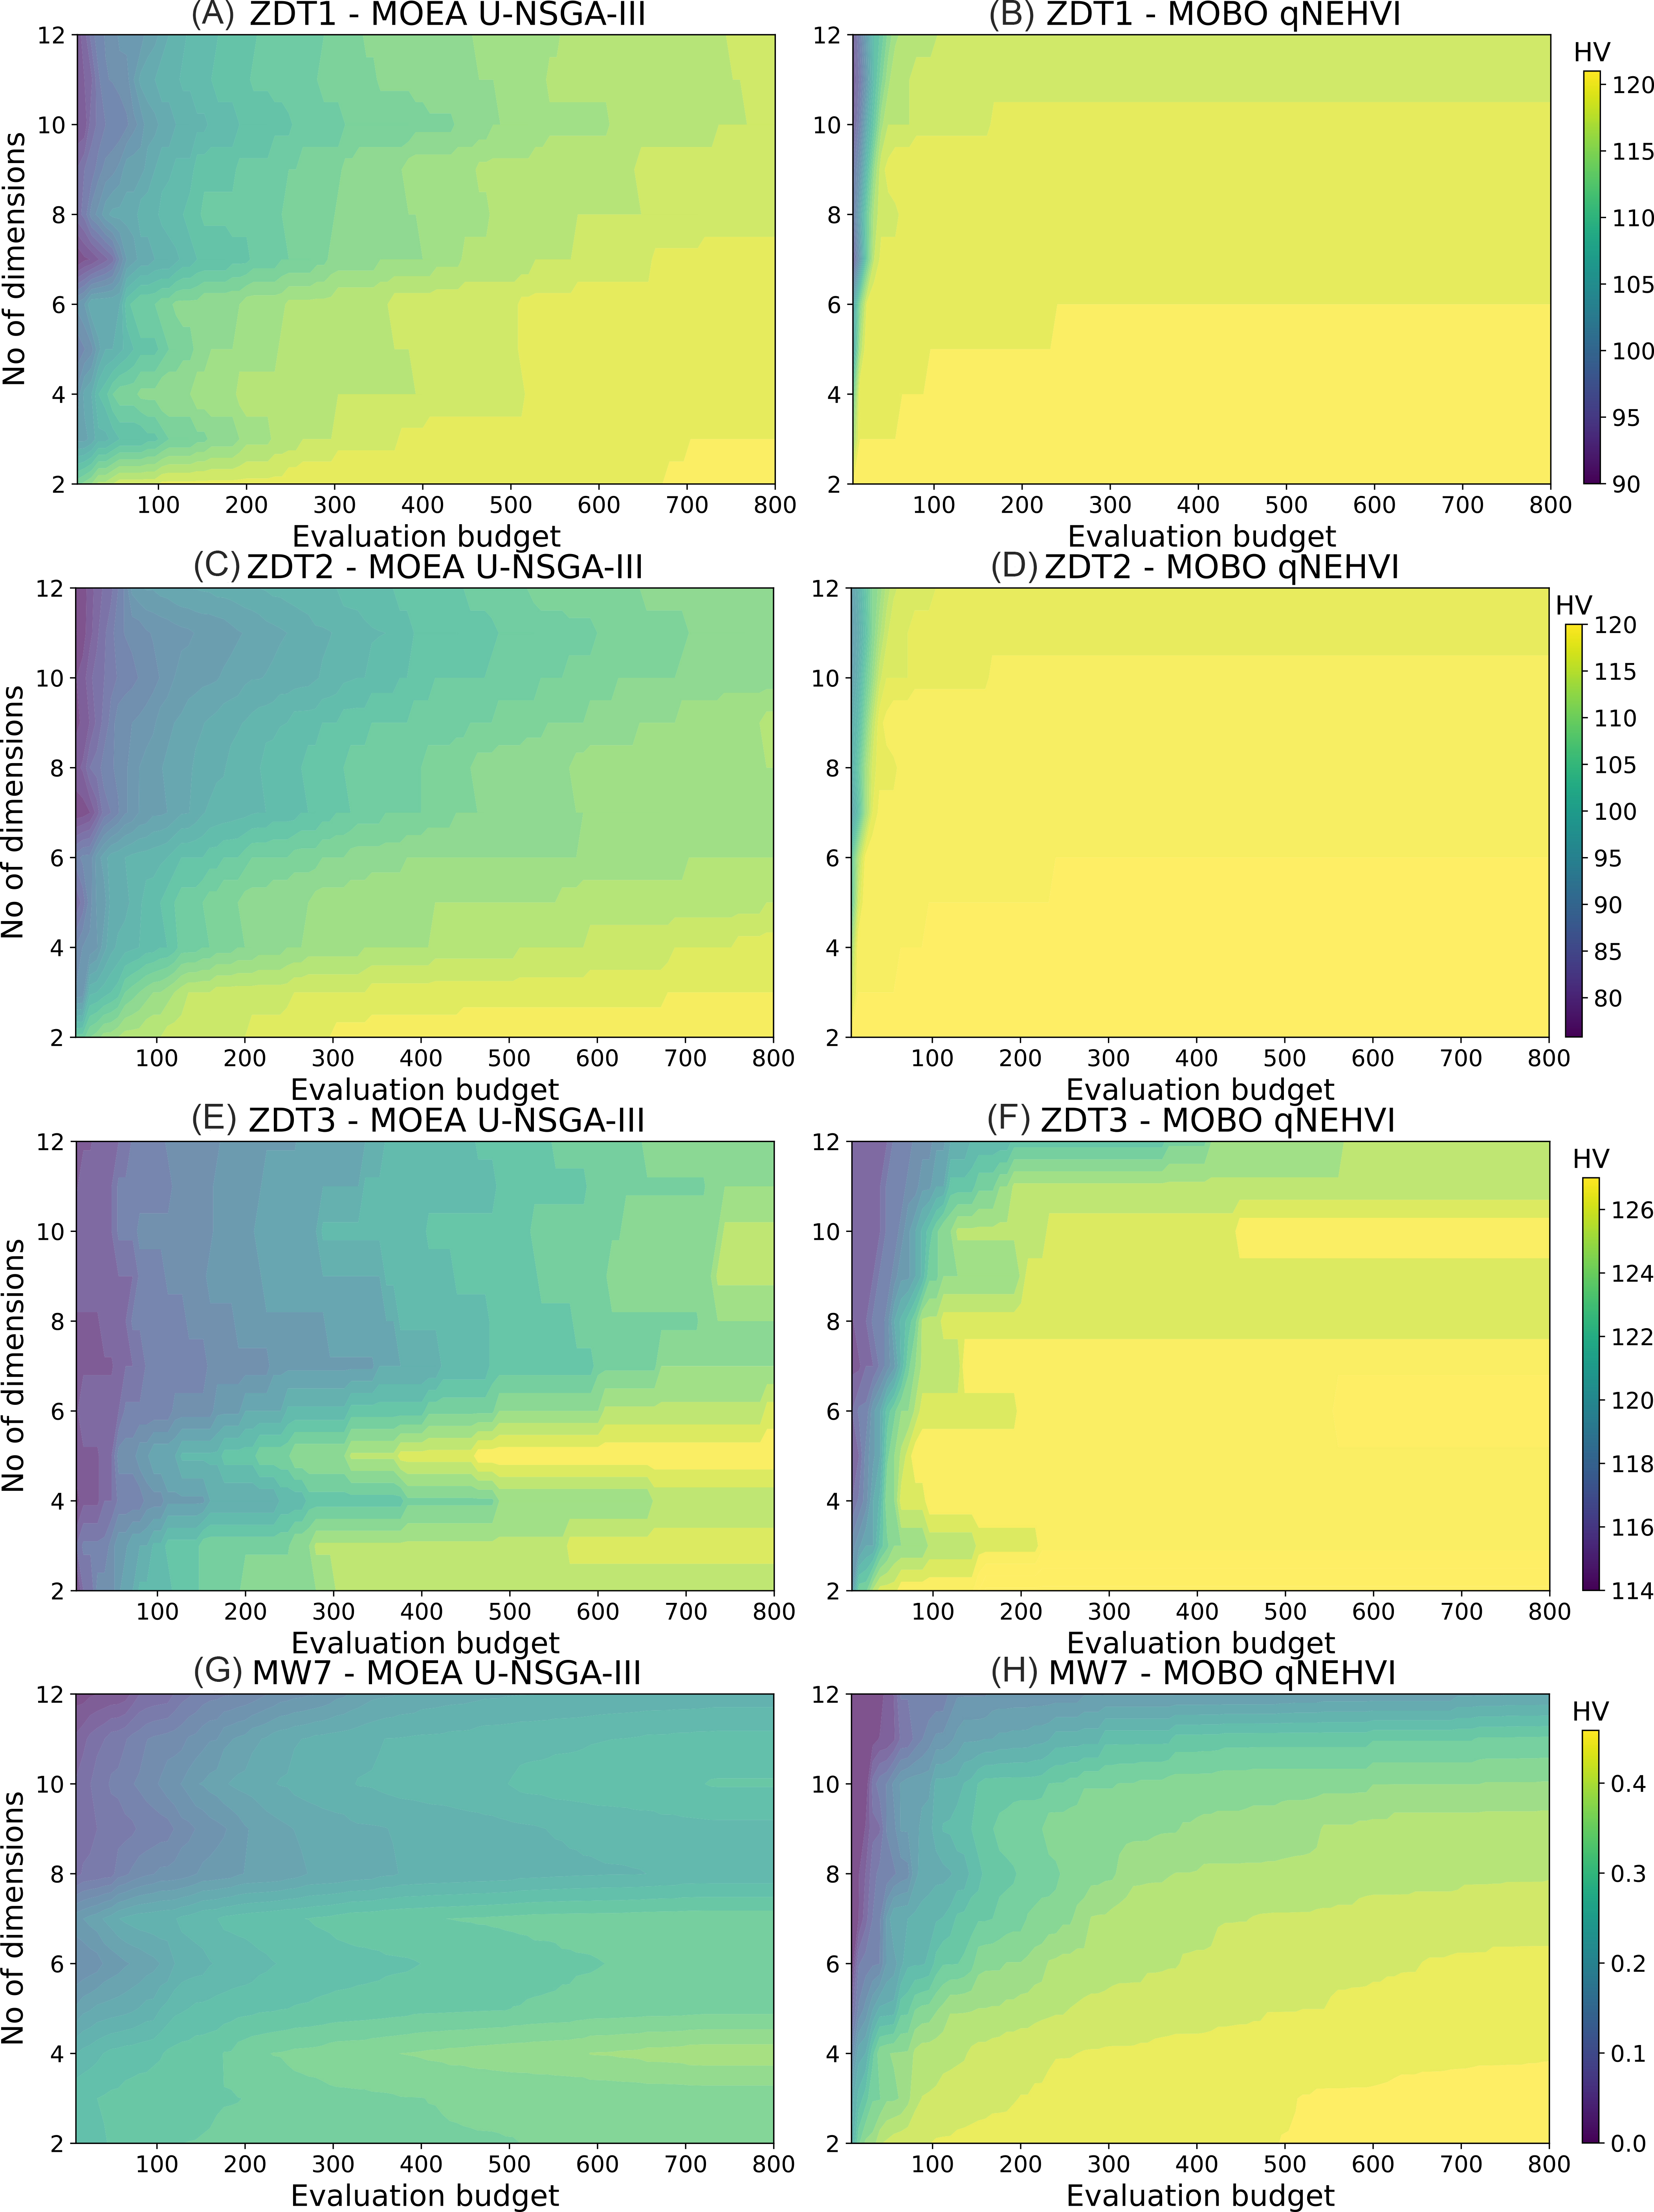
Figure 3. Contour plots for dimension vs evaluation budget. (A and B) ZDT1; (Cand D) ZDT2; (E and F) ZDT3; (G and H) MW7. The color bar illustrates the mean cumulative HV score with respect to cumulative evaluations, over a total evaluation budget of 100 iterations × 8 points per batch. Results are averaged over only 5 runs due to the high computational cost of searching over many dimensions. The results here show that qNEHVI is a far superior method when looking at only HV as a performance metric. HV: hypervolume; MOBO: multi-objective Bayesian optimization; MOEA: multi-objective evolutionary algorithms; qNEHVI: q-Noisy Expected Hypervolume Improvement; U-NSGA-III: Unified Non-dominated Sorting Genetic Algorithm III.


