


Boosting the ionic conductivity of amorphous oxychloride solid electrolytes via different degrees of amorphization


Abstract
Solid electrolytes provide improved safety, greater electrochemical and thermal stability, and better compatibility with high-energy materials than liquid electrolytes. Compared to crystalline solid electrolytes, amorphous solid electrolytes offer reduced grain boundary resistance, enhanced processability, isotropic ionic conductivity and superior mechanical properties. Herein, the impacts of varying high-energy ball milling intensities on the degree of amorphization of amorphous 1.6Li2O-TaCl5 oxychloride and thus its ionic conductivity are investigated. It is shown that the ionic conductivity of amorphous 1.6Li2O-TaCl5 can reach as high as 8.30 × 10⁻³ S/cm at room temperature by increasing the degree of amorphization. Furthermore, the sample exhibiting the highest ionic conductivity also releases the largest stored enthalpy upon heating, indicating that structural defects in amorphous 1.6Li2O-TaCl5 materials play a crucial role in enhancing their Li-ion conductivities. This discovery opens the door for boosting the ionic conductivities of other amorphous electrolytes in the future by increasing the degree of amorphization.

Keywords
INTRODUCTION
Lithium-ion batteries (LIBs) have become indispensable in modern energy storage systems. Using solid-state electrolytes (SSEs) instead of organic liquid electrolytes is expected to solve the safety risk caused by the flammability of liquid electrolytes faced by LIBs[1]. SSEs also have the potential to widen the electrochemical windows and improve the energy densities of rechargeable batteries[2]. A wide range of SSEs have been developed and studied, including sulfide, oxide, halide, oxyhalide, phosphate, and polymer SEs. Specifically, sulfide-based SSEs, such as Li-argyrodite[3,4] and lithium germanium phosphorus sulfide (LGPS) type materials[5,6] (e.g., Li10GeP2S12), have the advantage of high ionic conductivity and easy processing, but suffer from the high moisture sensitivity and narrow electrochemical window. Some
Compared with crystalline SSEs, amorphous SSEs lack long-range order and present the primary advantages of softness, easy fabrication, low grain boundaries and wide composition variations[24-27]. Furthermore, the lack of long-range order in the amorphous structure results in more flexible and isotropic ionic pathways, reducing constraints on ion movement. The irregular potential energy landscape in amorphous materials leads to lower and fewer energy barriers, allowing ions to move more freely with less resistance[24-27]. Amorphous SSEs can be synthesized using various methods, including high-energy ball milling,
In this study, we investigate whether the ionic conductivity of amorphous LOTC oxychloride can be further improved over 6.6 × 10⁻³ S/cm at 25 °C reported previously[31] via control in the degree of amorphization. By altering the intensity of high-energy ball milling, it is demonstrated that an ionic conductivity of
EXPERIMENTAL
Material synthesis
Amorphous LOTC oxychloride powder was synthesized via high-energy ball milling using SPEX mills with the starting materials Li2O (purity > 97%, Sigma) and TaCl5 (purity > 99.99%, Oakwood Chemical). The degree of amorphization was controlled through the ball milling intensity by changing the ball milling time or the density of balls. A typical synthesis consisted of 1 g of Li2O + TaCl5 mixture (mixed in a 1.6-to-1.0 molar ratio) and 20 g of stainless steel (SS) balls of 5 mm in diameter, leading to a ball-to-powder ratio of 20 to 1 (w/w). The powder mixture and steel balls were loaded in a SPEX mill canister inside an Ar-filled glovebox and sealed completely before being taken out for ball milling. Samples with different ball milling times are summarized in Table 1. To alter the ball milling intensity in addition to just changing the ball milling time, LOTC powder samples were also ball milled using ZrO2 balls of 5 mm in diameter with the ball-to-powder ratio being 40 to 1 (w/w). To avoid significant temperature rise of the canister during ball milling, all ball milling was stopped after 1 h and rested for 30 min before continuing for another 1-h,
Summary of ball milling conditions and ionic conductivity of various samples
| Sample ID | Ball milling conditions | Total conductivity (S/cm) | Unknown crystalline phase(s) (%) | Amorphous phase (%) | Crystalline LiCl (%) |
| 7 | SS balls for 1 h | 7.17 × 10⁻³ | 4.38 | 88.89 | 6.73 |
| 8 | SS balls for 1 h + 15 min | 8.30 × 10⁻³ | 0.00 | 92.82 | 7.18 |
| 5 | SS balls for 1 h + 30 min | 6.94 × 10⁻³ | 5.68 | 84.12 | 10.20 |
| 6 | SS balls for 1 h + 60 min | 5.63 × 10⁻³ | 2.13 | 83.06 | 14.81 |
| 4 | SS balls for 1 h + 120 min | 3.54 × 10⁻³ | 3.06 | 81.67 | 15.27 |
| 9 | ZrO2 balls for 1 h + 15 min | 0.063 × 10⁻³ | 5.03 | 85.37 | 9.60 |
| 1 | ZrO2 balls for 10 h | 0.19 × 10⁻³ | 2.20 | 76.72 | 21.08 |
Material characterization
X-ray diffraction (XRD) was utilized for phase identification and quantification of the as-synthesized amorphous LOTC powder. Crystalline Si powder was mixed with the as-synthesized LOTC powder in a 1:1 weight ratio to serve as the internal standard for phase identification and quantification. The Si + LOTC powder mixture was mixed uniformly through grinding in an agate mortar until a homogeneous color was achieved. The XRD patterns were collected using a Bruker D2 PHASER diffractometer in Bragg-Brentano geometry, employing a Ni-filtered Cu Kα radiation (1.5405 Å) and a LynxEye linear position sensitive detector with a step width of 0.01° 2θ and a counting time of 3.5 s/step. To avoid reactions with moisture during the XRD data collection, sample powder was sealed with a Kapton tape. The phase quantification involved comparing the integrated intensities of the diffraction peaks of the phases in the sample to those of the Si reference material. The quantities of the amorphous and crystalline phases are estimated by[32]
where Wi is the weight percentage of phase i, Wref indicates the weight of the reference in the sample, Wtot denotes the total weight of the sample, Ii stands for the integrated intensity of the diffraction peaks for phase i in the sample, Iref represents the integrated intensity of the diffraction peak of the reference material, and
DSC analysis was conducted using the Setsys 16/18 DTA/DSC from Setaram to determine the stored enthalpy in the amorphous phase and the crystallization temperatures if present. The DSC analyses were performed from 30 °C to 300 °C inside an aluminum crucible covered with a lid under a flowing argon atmosphere with a heating and cooling rate of 5 °C/min.
Electrochemical measurement
First, 200~300 mg of LOTC powder was cold pressed at 200 MPa and then heated to 100 °C to form a pellet in a steel die with a garolite sleeve. The impedance of the pellet with a setup of SS/LOTC/SS was measured via electrochemical impedance spectroscopy (EIS, Gamry INTERFACE 1010E) over a frequency range of
where σ is the conductivity, L is the thickness of the pellet, R is the resistance and A is the area of the pellet. DC polarization was conducted with a voltage of 5 V right after the EIS measurement. The cyclic voltammetry (CV) was conducted using Gamry INTERFACE 1010E with a semi-blocking cell having a
RESULTS AND DISCUSSION
Materials characterization of ball milled products
The XRD patterns of various samples are summarized in Figure 1 which has arranged the XRD patterns of samples with gradually increased ball milling time from the top to the bottom except for the very last sample ball milled using ZrO2 balls. Several trends are noted. First, all samples contain a small amount of crystalline LiCl byproduct. Second, all samples have a significant amount of amorphous phase. Third, some samples (e.g., samples 1, 4, 5, 6 and 7) also have unknown crystalline phase(s). By comparing the integrated intensities of the diffraction peaks of the phases in the sample to those of the Si internal reference and utilization of Eqs. (1) and (2), the quantities of crystalline LiCl byproduct along with the amorphous phase and unknown crystalline phase(s) in all samples have been estimated and summarized in Table 1. A close examination of Table 1 reveals that the quantity of each phase is a function of the ball milling time and the balls used. Specifically, sample 7 with 1-h ball milling time has the lowest LiCl content among all samples and the LiCl content increases gradually when the ball milling time increases. In contrast, the quantities of the unknown crystalline phase(s) do not show such a clear dependance on the ball milling time. In addition, sample 8 with 1 h + 15 min ball milling time has the highest quantity of the amorphous phase among all samples.

Figure 1. XRD patterns of various ball milled samples as a function of ball milling conditions. See Table 1 for the details of ball milling conditions. XRD: X-ray diffraction.
The seemingly complex trends of the quantities of the amorphous LOTC phase and crystalline LiCl as a function of the ball milling time could be rationalized based on the nature of high-energy ball milling. It is well known that high-energy ball milling carried out using SPEX, attritor and planetary mills leads to repeated deformation, fracture and cold-welding of particles, introduction of structural defects (such as vacancies, dislocations and grain boundaries) into crystalline materials, the formation of an amorphous phase, and even the formation of new compounds via in-situ reactions between the reactants[34-40]. Furthermore, after the formation of an amorphous phase, a crystalline phase can form in situ during high-energy ball milling through crystallization of the amorphous phase[39]. In particular, the following two studies are very helpful in understanding the results of the present study. Specifically, a previous study on high-energy ball milling of Si + graphite mixture reveals that crystalline and amorphous SiC can be formed through in-situ reactions during ball milling, depending on the ball milling conditions[40]. A different study on high-energy ball milling of anatase-TiO2 shows that after a sufficient ball milling time amorphous TiO2 can be formed and further ball milling can result in crystallization of the in-situ formed amorphous TiO2 to become crystalline rutile-TiO2[39].
Based on the mechanisms established in the previous studies[34-40], synthesis of amorphous LOTC electrolyte through in-situ solid-state reactions between Li2O and TaCl5 enhanced by high-energy ball milling can be envisioned as a result of several simplified processes. These include (i) particle size reduction of Li2O and TaCl5 powders, (ii) introduction of internal strains and various structural defects into Li2O and TaCl5 powders, (iii) chemical reaction of Li2O with TaCl5 to form amorphous LOTC compound, and (iv) formation of crystalline LiCl through decomposition and crystallization of some amorphous LOTC compound. Process (iii) is expected to be enhanced by processes (i) and (ii) through the mechanisms of high reaction interface areas and short diffusion paths maintained dynamically by repeated fracture and coalescence of Li2O and TaCl5 powder particles, whereas process (iv) is likely due to the temperature rise at the ball collision site which can be as high as 180 °C[38], 325 oC[39], 350 °C[35], and 500 °C[34], depending on the ball milling conditions and powder properties. Based on the proposed simplified processes, several statements can be made. First, 1-h ball milling with SS balls of 5 mm diameter and a charge ratio of 20:1 is sufficient to convert crystalline Li2O + TaCl5 mixture to an amorphous phase with formation of 6.73 wt% crystalline LiCl and a small amount of unknown crystalline phase(s). Second, when the ball milling time increases to 1 h and 15 min, more amorphous phase is formed with formation of 7.18 wt% crystalline LiCl. Third, as the ball milling time increases beyond 1 h and 15 min, the quantity of the amorphous phase starts to decrease because decomposition and crystallization of the amorphous phase to form crystalline LiCl become dominant processes. Since the nature of the unknown crystalline phase(s) is unclear at this stage, it is not appropriate to make comments on the nature of amorphization of the unknown crystalline phase(s).
It is interesting to note that sample 9 using ZrO2 balls with 1 h + 15 min ball milling time has less amorphous phase than sample 8 which also has 1 h + 15 min ball milling time but uses SS balls. The lower quantity of the amorphous phase in sample 9 can be attributed to the lower density of ZrO2 balls
Electrochemical properties of ball milled products
The impedances of all as-synthesized LOTC powders were determined using EIS. The Nyquist plots for samples 1, 6 and 8 are shown in Figure 2. The Nyquist plots of samples 4, 5 and 7 are similar to those of samples 6 and 8, as shown in Supplementary Figure 1 to avoid crowdedness of Figure 2. It is clear that sample 1 has an incomplete semicircle at the high and intermediate frequency range, followed by a straight line at the low-frequency region. An equivalent circuit, R[Q(QR)]W shown in Figure 2, is used to fit the impedance spectrum of sample 1. It is known that the intercept of the semicircle with the real axis at the highest frequency typically represents the bulk resistance Rbulk derived from the resistance to Li-ion transport inside solid electrolyte particles, whereas Rgb determined from the semicircle is normally attributed to the resistance of Li-ion diffusion via grain boundaries and/or particle interfaces[33,41,42]. Given that sample 1 is mainly composed of an amorphous phase, the value of Rbulk is assigned to the resistance to Li-ion transport inside the amorphous phase, whereas Rgb is attributed to the resistance of Li-ion diffusion via the interface of the amorphous phase. The result from the equivalent circuit fitting reveals that the bulk conductivity of the amorphous phase sbulk and the conductivity at the interface sgb are 3.17 × 10⁻⁴ and

Figure 2. EIS curves of samples 1, 6 and 8. The insert shows the enlarged portion of samples 6 and 8 at the high-frequency range. The equivalent circuit used for curve fitting of sample 1 is provided as well. EIS: Electrochemical impedance spectroscopy.
In order to understand the influence of crystalline LiCl on the stotal of LOTC samples, pure crystalline LiCl powder was pressed into pellets under 200 MPa at 100 oC and subsequently their conductivities were measured using EIS at 100 oC and RT. The Nyquist plots of crystalline LiCl at 100 oC and RT are shown in Supplementary Figure 2A and B, respectively. It is found that R[Q(QR)]W equivalent circuits fit their EIS curves well, revealing that the stotal of crystalline LiCl stotal is ~1.52 × 10⁻⁷ S/cm at 100 oC. At RT, the stotal drops substantially to 5.89 × 10⁻¹⁰ S/cm. These results unambiguously reveal that the stotal of crystalline LiCl at RT is seven orders of magnitude lower than that of LOTC samples. Therefore, it can be concluded that the presence of crystalline LiCl inside LOTC samples is detrimental to the stotal of LOTC samples. This conclusion is consistent with the data listed in Table 1 based on which the stotal of LOTC samples as a function of the crystalline LiCl quantity is shown in Figure 3A which reveals a clear trend: increasing the quantity of crystalline LiCl leads to lower stotal of LOTC samples.

Figure 3. (A) The total conductivity of LOTC samples as a function of the quantity of crystalline LiCl phase; and (B) the total conductivity of LOTC samples as a function of the amorphous phase quantity, showing two clear trends: (i) decreasing the total conductivity with increasing the crystalline LiCl and (ii) increasing the total conductivity with increasing the amorphous phase. The dashed lines serve as a guide for the eyes only. LOTC: 1.6Li2O-TaCl5.
To find out how other phases affect the conductivity of LOTC samples, the stotal of LOTC samples as a function of the amorphous phase quantity, the unknown crystalline phase quantity, and the quantity of the crystalline LiCl plus the unknown crystalline phase are plotted in Figure 3B, Supplementary Figures 3 and 4, respectively. A general trend of increasing the quantity of the amorphous phase leading to enhancement in the stotal of LOTC samples is observed in Figure 3B. More importantly, sample 8 has the highest quantity of the amorphous phase and the highest ionic conductivity in spite of its higher LiCl content than that of sample 7. These trends unambiguously reveal that it is the amorphous phase that provides high ionic conductivity to LOTC samples. No clear trends are observed for the quantity of the unknown crystalline phase [Supplementary Figure 3]. Taking all the data in Table 1, Figures 2 and 3, and Supplementary Figures 1-4 together, it can be concluded that (i) it is the amorphous phase that offers high ionic conductivity to LOTC samples, (ii) crystalline LiCl is detrimental to the stotal of LOTC samples, and (iii) the effects of the unknown crystalline phase(s) on the stotal of LOTC samples are small.
To separate the electronic and ionic conductivities, DC polarization experiments were conducted with the application of a 5 V voltage [Figure 4A and Supplementary Figure 5]. The electronic conductivity of sample 8, which has the highest stotal, is determined at 4,000 s of the Direct current (DC) polarization experiment and found to be 2.46 × 10⁻⁹ S/cm which is significantly lower than its stotal (8.30 × 10⁻³ S/cm). The electronic conductivity of sample 1, which has the lowest stotal (0.19 × 10⁻³ S/cm) in this study, is found to be
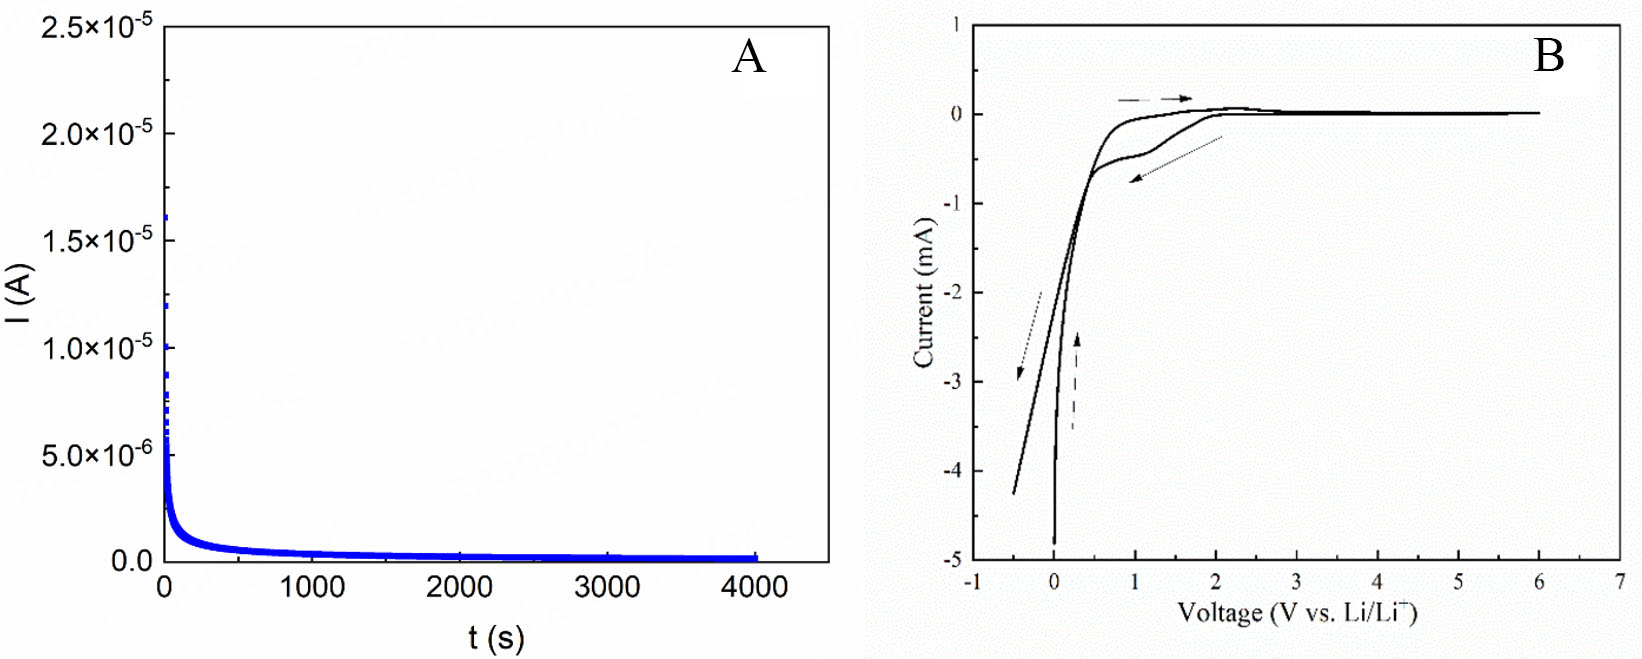
Figure 4. (A) Direct current polarization curve and (B) cyclic voltammetry curve of sample 8 with a semi-blocking cell setup of SS/sample 8/Li/SS, measured at RT. SS: Stainless steel; RT: room temperature.
CV analysis is conducted at RT with a scanning rate of 1 mV/s within the range of -0.5 V to 6.0 V vs. Li+/Li. The scan starts at 0.0 V, increases to 6.0 V, and then decreases to -0.5 V vs. Li+/Li [Figure 4B]. It is noted that there is an oxidation peak at ~2.3 V and a reduction peak at ~1.3 V, but sample 8 is stable against oxidation between 2.3 V and 6.0 V (the upper limit of our device). The CV scan starting at the open circuit voltage (OCV=1.99 V) is also measured [Supplementary Figure 6]. The conclusion obtained is the same as that obtained from the CV measurement starting from 0 V [Figure 4B]. Thus, LOTC electrolytes have the potential to be used as an electrolyte for many cathode materials including 5 V cathodes (such as
Degree of amorphization and its effects
A scientifically interesting and technologically important question is whether ionic conductivity is affected by the degree of amorphization. The following phenomena appear to indicate that this is indeed the case. First, the highest ionic conductivity of LOTC samples obtained in this study (8.3 × 10⁻³ S/cm) is 25% higher than the highest ionic conductivity (6.6 × 10⁻³ S/cm) reported previously[31] even though the chemical compositions of the two studies are the same. Second, there is no linear relationship between the ionic conductivity and the quantity of the amorphous phase [Figure 3B], suggesting that the bulk conductivity of the amorphous phase may change with the nature of the amorphous phase. A direct way to confirm whether this is the case would be to explore the structure of the LOTC amorphous phase that has been studied using Raman spectroscopy, X-ray photoelectron spectroscopy, and X-ray absorption spectroscopy in the previous report[31]. The LOTC amorphous phase has been identified to be composed of two major local structure units, [TaCl4O]- and [TaCl5-aOa]a- (2 ≤ a < 5), with Li+ ions mainly interacting with Cl- ions via unsaturated Ta-Cl…Li bonds[31]. The disordered and irregular [TaCl5-aOa]a- arrangements in the amorphous LOTC make it possible to form rich Li-Cl interactions and distorted Li-Cl sublattices, while O atoms act as bridges to connect Ta-centered trigonal bipyramids to form the macromolecule network. The unsaturated Ta-Cl…Li bonds in [TaCl5-aOa]a- have weak Coulombic forces between Li and Cl, making it easier for Li ions to escape from one site and jump to another[31]. If the ionic conductivity of the amorphous LOTC phase changes with the degree of amorphization, then the local structure units and/or their arrangements would have altered as the degree of amorphization changes. This possibility is addressed below through both theoretical arguments and experimental studies.
It is well documented that severe mechanical shear occurs and introduces significant structural defects to powder particles during high-energy ball milling[37,39,40,43]. We postulate that severe mechanical shear can alter the disordered and irregular [TaCl5-aOa]a- arrangements in amorphous LOTC, leading to more structural defects (such as more Li-ion vacancies and further distortion of Li-Cl sublattices) in the amorphous phase and thus making it easier for Li ions to jump from one site to another with improved ionic conductivities as the degree of amorphization increases. Structural defects stored in the amorphous phase are in a high energy state and provide a driving force for the amorphous phase to change to the structural arrangement with lower structural defects and even to crystalline phases through crystallization. Should such events occur, the energy stored in the amorphous phase will be released, which can be detected via DSC. Therefore, several LOTC samples are analyzed via DSC by heating to 300 oC in an Ar atmosphere with a heating rate of 5 oC/min. As expected, all LOTC samples release some stored enthalpy upon heating to 300 oC [Figure 5]. However, the DSC curves and the quantities of the released enthalpy are different for LOTC samples with different ball milling conditions. Specifically, samples 8 and 6 exhibit three exothermic peaks, whereas sample 1 only displays one. Furthermore, peaks 2 (P2) and 3 (P3) for samples 8 and 6 are overlapped and can be separated via curve fitting [Supplementary Figure 7]. The area under each peak normalized by the sample weight represents the quantity of the released enthalpy per gram of the sample for each peak event, and is summarized in Table 2. It can be seen that the quantity of the released enthalpy for each event depends on the sample ball milling conditions, suggesting the complexity of changing the amorphous phase from high energy states to low energy states. Nevertheless, sample 8 releases the largest total enthalpy per milligram of the sample (5.572 mW/mg for P1+P2+P3), followed by sample 6 and then sample 1.

Figure 5. DSC curves of samples 8 (1 h + 15 min ball milling), sample 6 (1 h + 1h ball milling), and sample 1 (10 h ball milling). The exothermic peaks (i.e., release of the stored enthalpy) observed are marked as peak 1 (P1), peak 2 (P2) and peak 3 (P3). The DSC curves of 1 h+1 h and 10 h samples have been offset by 10 mW and 20 mW, respectively, with the dashed lines indicating their respective zero points. DSC: Differential scanning calorimetry.
Released enthalpy from LOTC samples when heating from RT to 300 oC
| Sample ID | P1 (mW/mg) | P2 (mW/mg) | P3 (mW/mg) | Total (P1 + P2 + P3) (mW/mg) |
| 8 | 0.304 | 3.754 | 1.514 | 5.572 |
| 6 | 0.573 | 1.553 | 2.7 | 4.826 |
| 1 | 0.249 | NA | NA | 0.249 |
It is noted that the baselines of these samples are different as well. In particular, sample 8 has a positive slope, whereas samples 6 and 1 have a much flat baseline. To find out whether different baselines also reflect energy release processes, the baseline of the DSC machine was determined as well using an empty crucible. As shown in Supplementary Figure 8, the baseline of the DSC machine has a negative slope, suggesting that samples 8, 6 and 1 all gradually release some stored energy during the heating process, but sample 8 has released the most since it has a positive slope as temperature increases from RT to 300 oC. Based on this baseline analysis and Table 2 data, it can be concluded unambiguously that sample 8 has released the largest amount of the stored energy and thus contains the highest defects in its amorphous structures, whereas sample 1 has the lowest defects. This trend is in good accordance with the observed ionic conductivity trend: LOTC samples with higher defects in their amorphous structures have higher ionic conductivities.
To understand the nature of each exothermic peak in the DSC curve, XRD patterns are taken after a sample has been heated passing the peak of interest [Figure 6]. It is found that peak 1 (P1) is associated with crystallization to form a small quantity of Li2O phase, whereas peak 2 (P2) is due to the formation of crystalline TaCl3O with a small amount of crystalline LiCl. Interestingly, at peak 3 (P3) temperature the newly formed crystalline TaCl3O disappears and a more crystalline LiCl phase is formed. Both samples 8 and 6 exhibit such structural evolution with three exothermic peaks although the onset temperature and peak temperature for these three crystallization events are different for samples 8 and 6. In contrast, sample 1 only exhibits a very broad peak 1 (P1). A possible reason for the absence of peaks 2 and 3 in sample 1 is that it is fabricated via high-energy ball milling using ZrO2 balls with a very long milling time (10 h), accompanied by the formation of a high concentration of crystalline LiCl phase at the as-synthesized condition [Table 1]. As a result, the high enthalpy of sample 1 induced by high-energy ball milling has been released via in-situ crystallization to form crystalline LiCl during ball milling. These results unequivocally reveal that optimization of high-energy ball milling conditions is essential to achieve the highest structural defects in the amorphous LOTC oxychloride and thus the highest possible ionic conductivity.

Figure 6. XRD patterns of LOTC sample 8: (a) before DSC heating, (b) after DSC heating to 210 oC, (c) after DSC heating to 250 oC, and (d) after DSC heating to 300 oC. LOTC: 1.6Li2O-TaCl5; XRD: X-ray diffraction; DSC: differential scanning calorimetry.
Finally, it is worth mentioning that one of the reasons for this study to obtain a higher ionic conductivity than the previous study[31] is the use of SS balls which have a higher density than ZrO2 balls used in the previous study. As a result, the impact intensity in our study is much higher than that in the previous study[31], leading to higher degrees of amorphization and higher ionic conductivity as demonstrated in this investigation. Another possible reason for a higher conductivity is the use of SPEX mills in this study. It is known that different ball milling devices such as SPEX, attritor, and planetary mills can lead to varying results in terms of the properties and characteristics of the final products[34,35]. Furthermore, SPEX mills have the highest impact energy among all mills. It is noted that the ball mill machine in the previous study[31] was not reported. Thus, it is not appropriate to discuss this topic further. However, it could be possible that a different type of ball milling machine was used in the previous study[31].
CONCLUSION
A systematic investigation on the formation and ionic conductivity of amorphous LOTC oxychloride has been carried out in this study. Different high-energy ball milling conditions have been applied to create amorphous LOTC oxychlorides with different ionic conductivities and stored enthalpies. Several conclusions can be drawn from this study.
1. The highest ionic conductivity (8.3 × 10⁻³ S/cm at RT) achieved in this study is obtained using SS balls with 1 h + 15 min milling time beyond which the conductivity starts to decrease. The obtained
2. The ionic conductivity of ball-milled LOTC is mainly controlled by the quantities of the amorphous phase and crystalline LiCl byproduct in the sample.
3. The reaction byproduct, crystalline LiCl, is harmful to the ionic conductivity because of its very low stotal.
4. The quantities of the amorphous phase and crystalline LiCl phase in the LOTC sample depend on the ball milling conditions. Specifically, crystalline LiCl content increases gradually with increasing the milling time.
5. The sample ball milled with ZrO2 balls has the lowest ionic conductivity because this sample has the highest quantity of crystalline LiCl.
6. DSC analysis reveals that the sample with the highest ionic conductivity releases the highest stored enthalpy upon heating, suggesting that structural defects in amorphous LOTC samples are an important factor for boosting their Li-ion conductivity.
DECLARATIONS
Authors’ contributions
Writing - original draft, methodology, investigation, formal analysis, data curation: Ou, J.
Methodology, investigation, formal analysis: Senevirathna, I.
Formal analysis, data curation: Tatagari, V.; Saleem, A.
Writing - review and editing, funding acquisition, formal analysis: Segre, C.
Writing - review and editing, supervision, project administration, investigation, funding acquisition, conceptualization: Shaw, L.
Availability of data and materials
The data that support the findings of this study are available in the Supplementary Materials of this article.
Financial support and sponsorship
This research was financially supported by the U.S. National Science Foundation (NSF) with the award number OISE-2230770. Leon Shaw is also grateful to the Rowe Family Endowment Fund, while Carlo Segre acknowledges the support from the Duchossois Leadership Endowment Fund.
Conflicts of interest
All authors declared that there are no conflicts of interest.
Ethical approval and consent to participate
Not applicable.
Consent for publication
Not applicable.
Copyright
© The Author(s) 2025.
Supplementary Materials
REFERENCES
1. Kong, L.; Li, C.; Jiang, J.; Pecht, M. G. Li-ion battery fire hazards and safety strategies. Energies 2018, 11, 2191.
2. Schnell, J.; Günther, T.; Knoche, T.; et al. All-solid-state lithium-ion and lithium metal batteries - paving the way to large-scale production. J. Power. Sources. 2018, 382, 160-75.
3. Zhou, L.; Assoud, A.; Zhang, Q.; Wu, X.; Nazar, L. F. New family of argyrodite thioantimonate lithium superionic conductors. J. Am. Chem. Soc. 2019, 141, 19002-13.
4. Adeli, P.; Bazak, J. D.; Park, K. H.; et al. Boosting solid-state diffusivity and conductivity in lithium superionic argyrodites by halide substitution. Angew. Chem. Int. Ed. 2019, 58, 8681-6.
5. Kamaya, N.; Homma, K.; Yamakawa, Y.; et al. A lithium superionic conductor. Nat. Mater. 2011, 10, 682-6.
6. Kato, Y.; Hori, S.; Saito, T.; et al. High-power all-solid-state batteries using sulfide superionic conductors. Nat. Energy. 2016, 1, 16030.
7. Sun, Y.; Guan, P.; Liu, Y.; Xu, H.; Li, S.; Chu, D. Recent progress in lithium lanthanum titanate electrolyte towards all solid-state lithium ion secondary battery. Crit. Rev. Solid. State. Mater. Sci. 2019, 44, 265-82.
8. Lu, J.; Li, Y. Perovskite-type Li-ion solid electrolytes: a review. J. Mater. Sci. Mater. Electron. 2021, 32, 9736-54.
9. Tao, B.; Ren, C.; Li, H.; et al. Thio-/LISICON and LGPS-type solid electrolytes for all-solid-state lithium-ion batteries. Adv. Funct. Mater. 2022, 32, 2203551.
10. Kobayashi, T.; Yamada, A.; Kanno, R. Interfacial reactions at electrode/electrolyte boundary in all solid-state lithium battery using inorganic solid electrolyte, thio-LISICON. Electrochim. Acta. 2008, 53, 5045-50.
11. Li, X.; Liang, J.; Chen, N.; et al. Water-mediated synthesis of a superionic halide solid electrolyte. Angew. Chem. 2019, 131, 16579-84.
12. Zhou, L.; Kwok, C. Y.; Shyamsunder, A.; Zhang, Q.; Wu, X.; Nazar, L. F. A new halospinel superionic conductor for high-voltage all solid state lithium batteries. Energy. Environ. Sci. 2020, 13, 2056-63.
13. Liu, X.; Mi, F.; Sun, C. A cost-effective Ca-doped Li2ZrCl6 halide solid electrolyte for all-solid-state lithium batteries. Chem. Commun. 2025, 61, 1144-7.
14. Braga, M. H.; Ferreira, J. A.; Stockhausen, V.; Oliveira, J. E.; El-azab, A. Novel Li3ClO based glasses with superionic properties for lithium batteries. J. Mater. Chem. A. 2014, 2, 5470-80.
15. Ou, J.; Tatagari, V.; Senevirathna, I.; et al. On the formation and properties of amorphous and crystalline Li3-yBay/2OCl electrolytes. J. Power. Sources. 2024, 609, 234685.
16. Tanaka, Y.; Ueno, K.; Mizuno, K.; Takeuchi, K.; Asano, T.; Sakai, A. New oxyhalide solid electrolytes with high lithium ionic conductivity >10 mS cm-1 for all-solid-state batteries. Angew. Chem. Int. Ed. 2023, 62, e202217581.
17. Bates, J.; Dudney, N.; Gruzalski, G.; et al. Fabrication and characterization of amorphous lithium electrolyte thin films and rechargeable thin-film batteries. J. Power. Sources. 1993, 43, 103-10.
18. Zou, Z.; Xiao, Z.; Lin, Z.; Zhang, B.; Zhang, C.; Wei, F. Lithium phosphorous oxynitride as an advanced solid-state electrolyte to boost high-energy lithium metal battery. Adv. Funct. Mater. 2024, 34, 2409330.
19. Yin, L.; Yuan, H.; Kong, L.; Lu, Z.; Zhao, Y. Engineering Frenkel defects of anti-perovskite solid-state electrolytes and their applications in all-solid-state lithium-ion batteries. Chem. Commun. 2020, 56, 1251-4.
20. Majeed, M. K.; Hussain, A.; Hussain, G.; et al. Interfacial engineering of polymer solid-state lithium battery electrolytes and Li-metal anode: current status and future directions. Small 2024, 20, 2406357.
21. Saleem, A.; Iqbal, R.; Majeed, M. K.; et al. Boosting lithium-ion conductivity of polymer electrolyte by selective introduction of covalent organic frameworks for safe lithium metal batteries. Nano. Energy. 2024, 128, 109848.
22. Shi, K.; Yu, C.; Zheng, D.; Yang, Z.; Zhang, W. Rational design of continuous and short-range lithium ion pathways based on polydopamine-anchored metal-organic frameworks for all-solid-state electrolytes. J. Energy. Chem. 2024, 99, 712-24.
23. Tan, J.; Wang, Z.; Cui, J.; et al. Sandwich-type composited solid polymer electrolytes to strengthen the interfacial ionic transportation and bulk conductivity for all-solid-state lithium batteries from room temperature to 120 °C. J. Energy. Chem. 2024, 95, 288-95.
24. Dai, T.; Wu, S.; Lu, Y.; et al. Inorganic glass electrolytes with polymer-like viscoelasticity. Nat. Energy. 2023, 8, 1221-8.
25. Hayashi, A.; Hama, S.; Morimoto, H.; Tatsumisago, M.; Minami, T. Preparation of Li2S-P2S5 amorphous solid electrolytes by mechanical milling. J. Am. Ceram. Soc. 2001, 84, 477-79.
26. Agostini, M.; Aihara, Y.; Yamada, T.; Scrosati, B.; Hassoun, J. A lithium-sulfur battery using a solid, glass-type P2S5-Li2S electrolyte. Solid. State. Ionics. 2013, 244, 48-51.
27. Wang, Y.; Ouyang, J.; Yuan, H.; et al. Impact of local amorphous environment on the diffusion of sodium ions at the solid electrolyte interface in sodium-ion batteries. Chin. Chem. Lett. , 2024, 110412.
28. Ding, J.; Ji, D.; Yue, Y.; Smedskjaer, M. M. Amorphous materials for lithium-ion and post-lithium-ion batteries. Small 2024, 20, 2304270.
29. Ishiguro, Y.; Ueno, K.; Nishimura, S.; Iida, G.; Igarashib, Y. TaCl5-glassified ultrafast lithium ion-conductive halide electrolytes for high-performance all-solid-state lithium batteries. Chem. Lett. 2023, 52, 237-41.
30. Li, F.; Cheng, X.; Lu, G.; et al. Amorphous chloride solid electrolytes with high Li-ion conductivity for stable cycling of all-solid-state high-nickel cathodes. J. Am. Chem. Soc. 2023, 145, 27774-87.
31. Zhang, S.; Zhao, F.; Chen, J.; et al. A family of oxychloride amorphous solid electrolytes for long-cycling all-solid-state lithium batteries. Nat. Commun. 2023, 14, 3780.
32. Dinnebier, R. E.; Billinge, S. J. Powder diffraction: theory and practice, Royal society of chemistry: 2015. https://books.google.com/books?id=wmQ_lFIMkFYC&printsec=frontcover&source=gbs_ge_summary_r&cad=0#v=onepage&q&f=false (accessed 2025-04-22).
33. Luo, M.; Ortiz, A. L.; Shaw, L. L. Unraveling processing-structure-electrical conductivity relationships of NaCrO2 cathodes for Na-ion batteries. J. Electrochem. Soc. 2019, 166, A3546.
34. Schwarz, R. B.; Koch, C. C. Formation of amorphous alloys by the mechanical alloying of crystalline powders of pure metals and powders of intermetallics. Appl. Phys. Lett. 1986, 49, 146-8.
35. Davis, R. M.; Mcdermott, B.; Koch, C. C. Mechanical alloying of brittle materials. Metall. Trans. A. 1988, 19, 2867-74.
36. Shaw, L. L.; Yang, Z.; Ren, R. Mechanically enhanced reactivity of silicon for the formation of silicon nitride composites. J. Am. Ceram. Soc. 1998, 81, 760-4.
37. Benjamin, J. S.; Volin, T. E. The mechanism of mechanical alloying. Metall. Trans. 1974, 5, 1929-34.
38. Schaffer, G. B.; Mccormick, P. G. On the kinetics of mechanical alloying. Metall. Trans. A. 1992, 23, 1285-90.
39. Ren, R.; Yang, Z.; Shaw, L. Polymorphic transformation and powder characteristics of TiO2 during high energy milling. J. Mater. Sci. 2000, 35, 6015-26.
40. Yang, Z.; Shaw, L. Synthesis of nanocrystalline SiC at ambient temperature through high energy reaction milling. Nanostruct. Mater. 1996, 7, 873-86.
41. Jolley, A. G.; Cohn, G.; Hitz, G. T.; Wachsman, E. D. Improving the ionic conductivity of NASICON through aliovalent cation substitution of Na3Zr2Si2PO12. Ionics 2015, 21, 3031-8.
42. Chiang, S.; Kaduk, J. A.; Shaw, L. L. High ionic conducting NaSICON enabled by mechanical activation enhanced reaction. Mater. Chem. Phys. 2024, 312, 128656.
Cite This Article

How to Cite
Download Citation
Export Citation File:
Type of Import
Tips on Downloading Citation
Citation Manager File Format
Type of Import
Direct Import: When the Direct Import option is selected (the default state), a dialogue box will give you the option to Save or Open the downloaded citation data. Choosing Open will either launch your citation manager or give you a choice of applications with which to use the metadata. The Save option saves the file locally for later use.
Indirect Import: When the Indirect Import option is selected, the metadata is displayed and may be copied and pasted as needed.
About This Article
Copyright


Comments
Comments must be written in English. Spam, offensive content, impersonation, and private information will not be permitted. If any comment is reported and identified as inappropriate content by OAE staff, the comment will be removed without notice. If you have any queries or need any help, please contact us at [email protected].