fig9

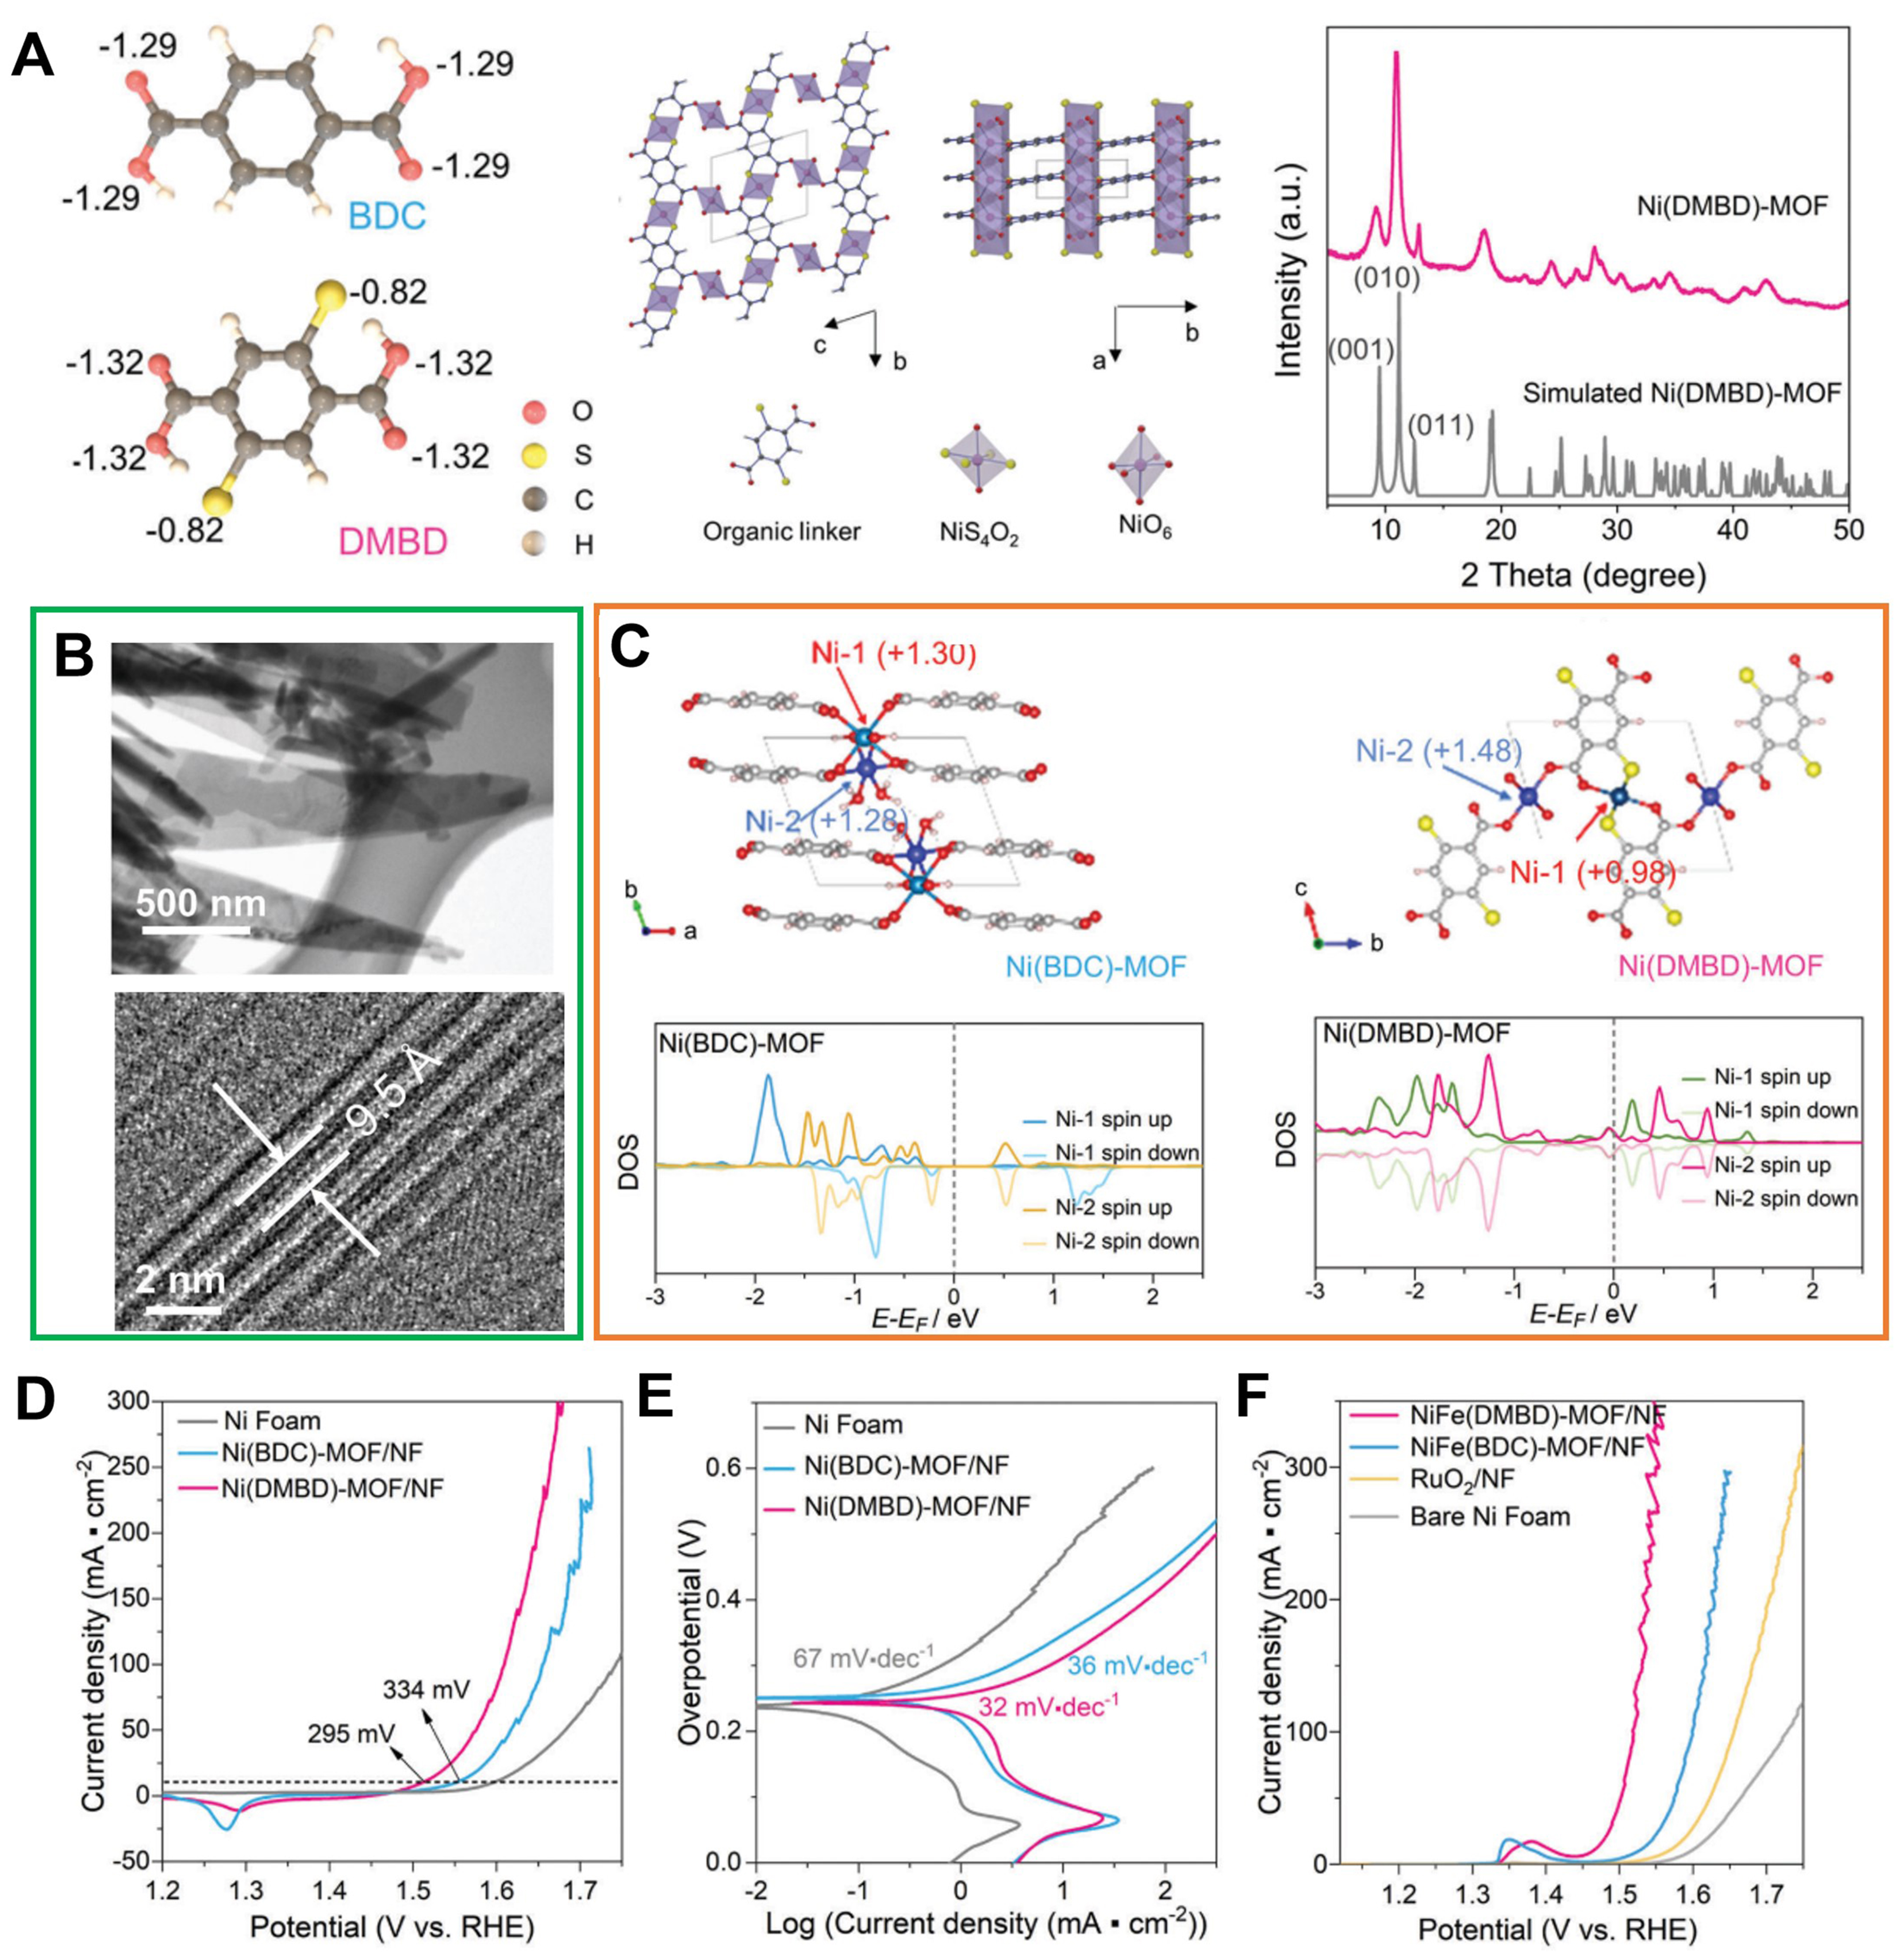
Figure 9. (A) Bader charge analysis of deprotonated BDC and DMBD ligands, the identified crystal structure model of Ni(DMBD) and XRD patterns for Ni(DMBD)-MOF from experiment result and simulated one; (B) TEM and HRTEM images presenting the side view of Ni(DMBD)-MOF nanosheet; (C) Scheme of Ni(BDC)MOF and Ni(DMBD)-MOF crystal structure showing the Ni-1 and Ni-2 sites as well as calculated DOS of Ni in Ni(BDC)-MOF and Ni(DMBD)-MOF; (D) OER polarization curves of Ni(BDC)-MOF/NF, Ni(DMBD)-MOF/NF, and bare NF electrode; (E) Tafel plots obtained with Ni(DMBD)-MOF/NF, Ni(BDC)-MOF/NF, and bare NF; (F) LSV plots obtained with NiFe(DMBD)-MOF/NF, NiFe(BDC)-MOF/NF, bare NF, and RuO2/NF for OER at 1 mV·s-1 in O2 saturated 1 m KOH. (A)-(F) were reproduced with permission[101]. Copyright 2022, Wiley-VCH. BDC: 1,4-benzenedicarboxylate; DMBD: 2,6-dimercaptanbenzene-1,4-dicarboxylate; XRD: X-ray diffraction; MOF: metal-organic framework; TEM: transmission electron microscopy; HRTEM: high-resolution transmission electron microscopy; DOS: density of states; OER: oxygen evolution reaction; NF: nickel foam; LSV: linear sweep voltammetry.


