fig11

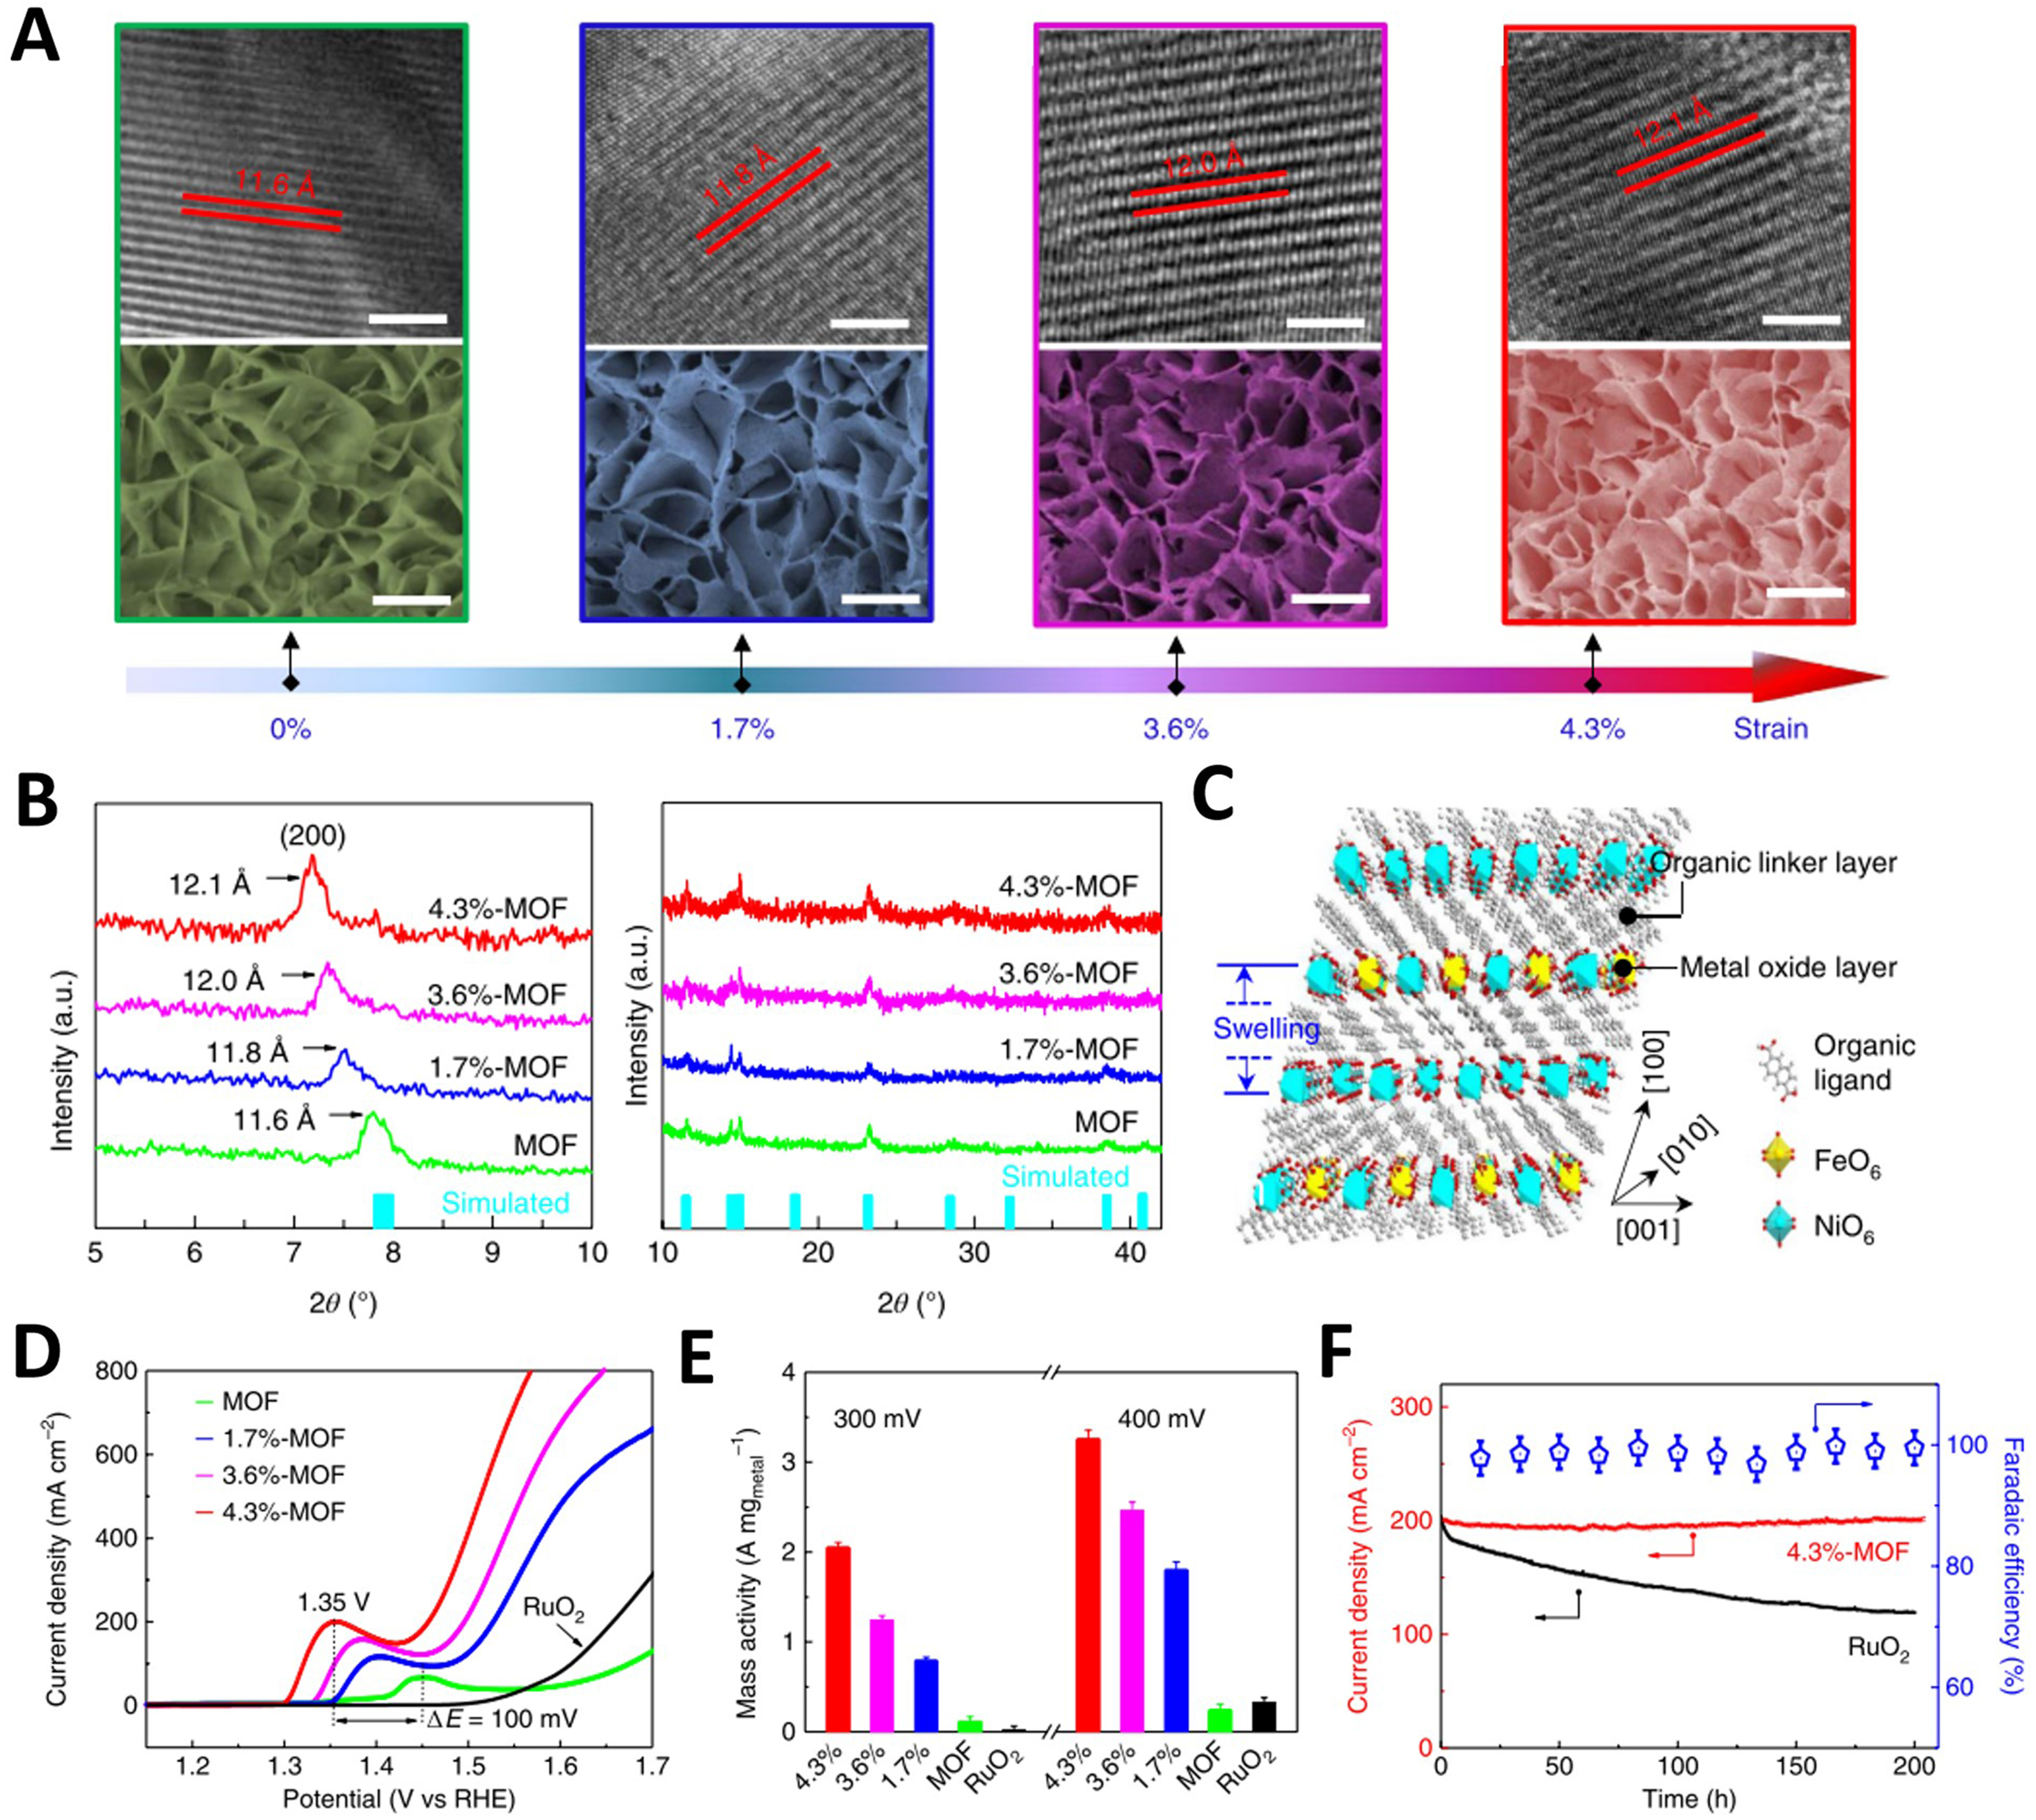
Figure 11. (A) HRTEM (top) and SEM (bottom) images of the pristine, 1.7%-, 3.6%- and 4.3%-MOFs. Scale bars, 5 nm for HRTEM and 200 nm for SEM; (B) XRD patterns for the pristine, 1.7%-, 3.6%- and 4.3%-MOFs in 2θ ranges of 5°-10° and 10°-42°, and XRD simulation of the NiFe MOF (turquoise bars); (C) Schematic diagram of crystal structure variation of NiFe MOFs under ultraviolet irradiation. LSV curves (D) and mass activity (E) of OER for the pristine, 1.7%-, 3.6%- and 4.3%-MOFs and commercial RuO2 measured in 0.1 M N2-saturated KOH; (F) OER stability for RuO2 and the 4.3%-MOF and OER FE of 4.3%-MOF. (A)-(F) were reproduced with permission[104]. Copyright 2019, Nature Publishing Group. HRTEM: High-resolution transmission electron microscopy; SEM: scanning electron microscope; MOF: metal-organic framework; XRD: X-ray diffraction; LSV: linear sweep voltammetry; OER: oxygen evolution reaction; FE: Faradaic efficiency.


