fig5

Expression characteristics, immune signatures, and prognostic value of the KIF family members identified across cancers

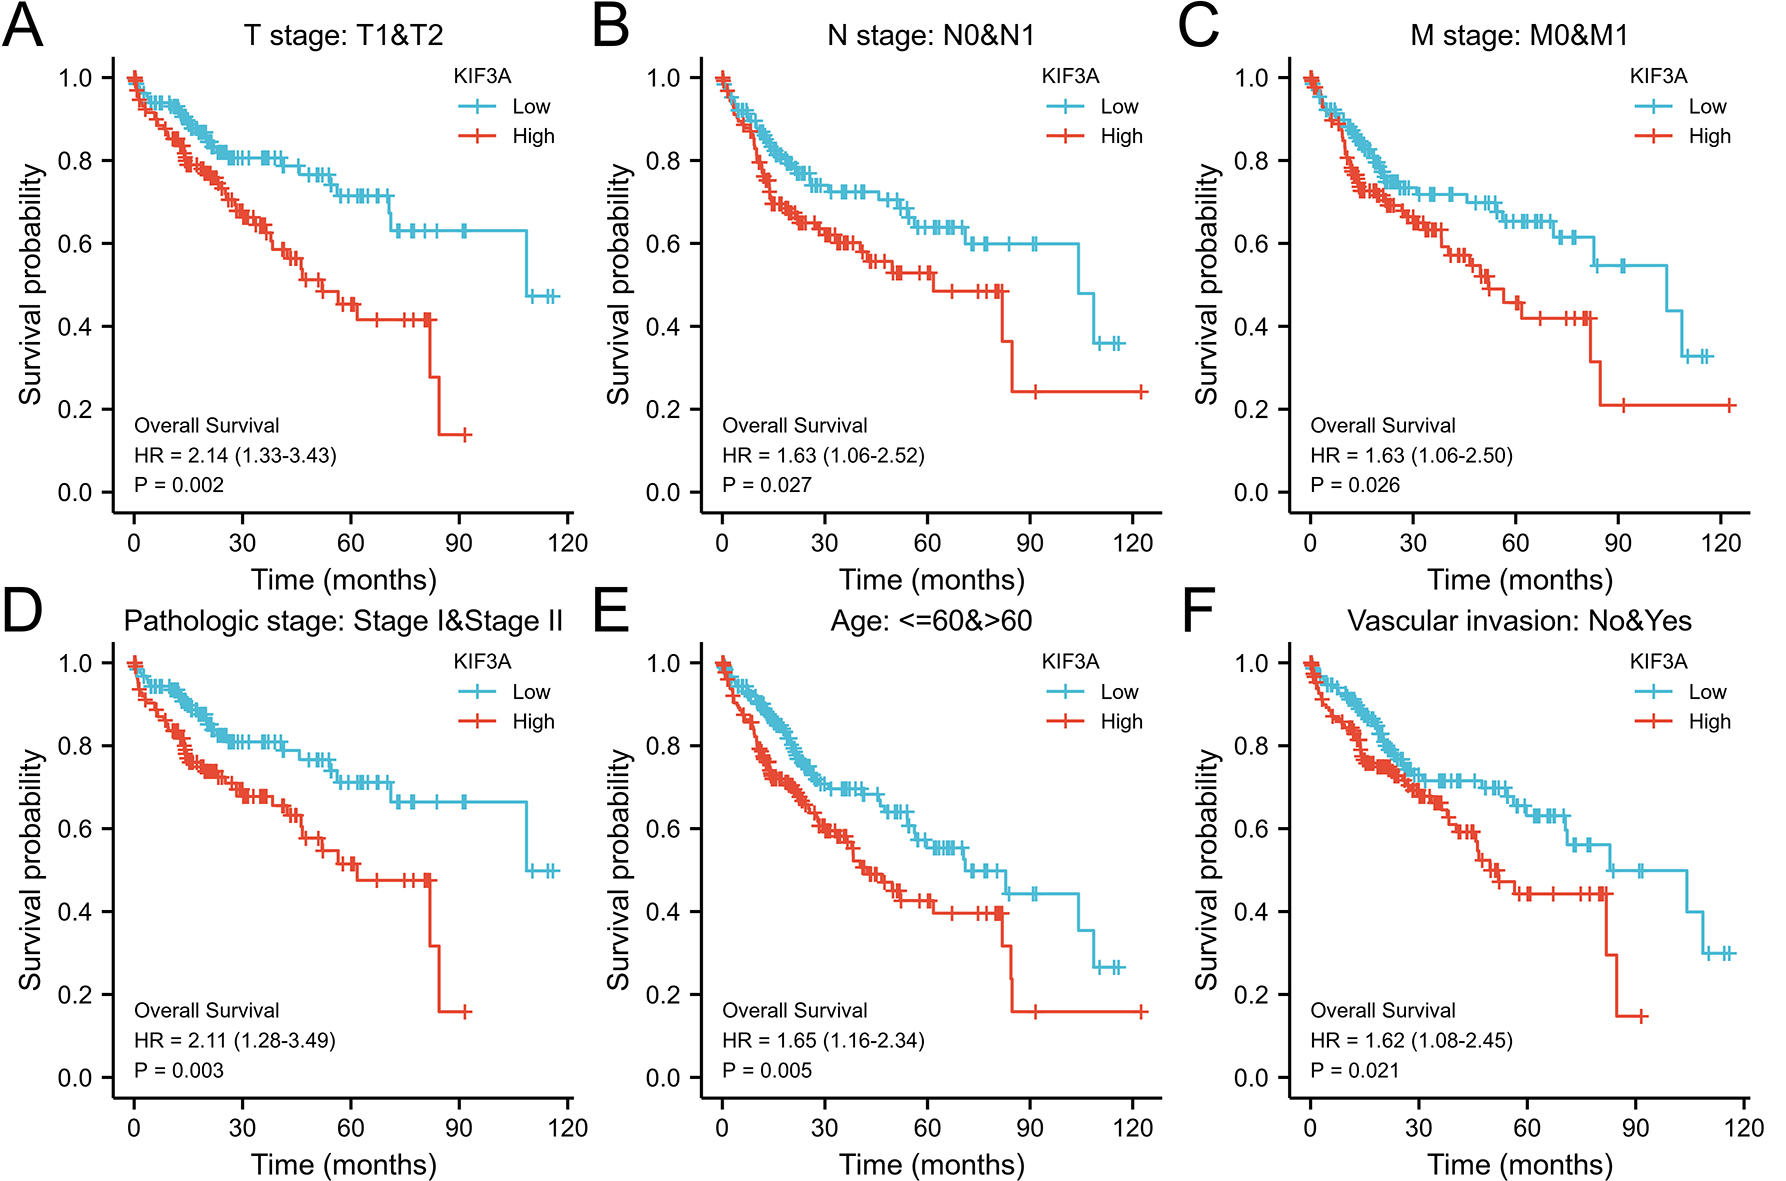
Figure 5. Kaplan-Meier analysis of the prognostic value of KIF3A expression in different HCC subgroups. (A-F) Comparison of OS curves for T1 and T2, N0 and N1, M0 and M1, pathological stage I and II, age > 60 years and vascular invasion subgroups in patients with high and low KIF3A expression in HCC.

Journal of Cancer Metastasis and Treatment
ISSN 2454-2857 (Online) 2394-4722 (Print)

Portico

All published articles are preserved here permanently:

https://www.portico.org/publishers/oae/

Portico

All published articles are preserved here permanently:

https://www.portico.org/publishers/oae/