


fig3
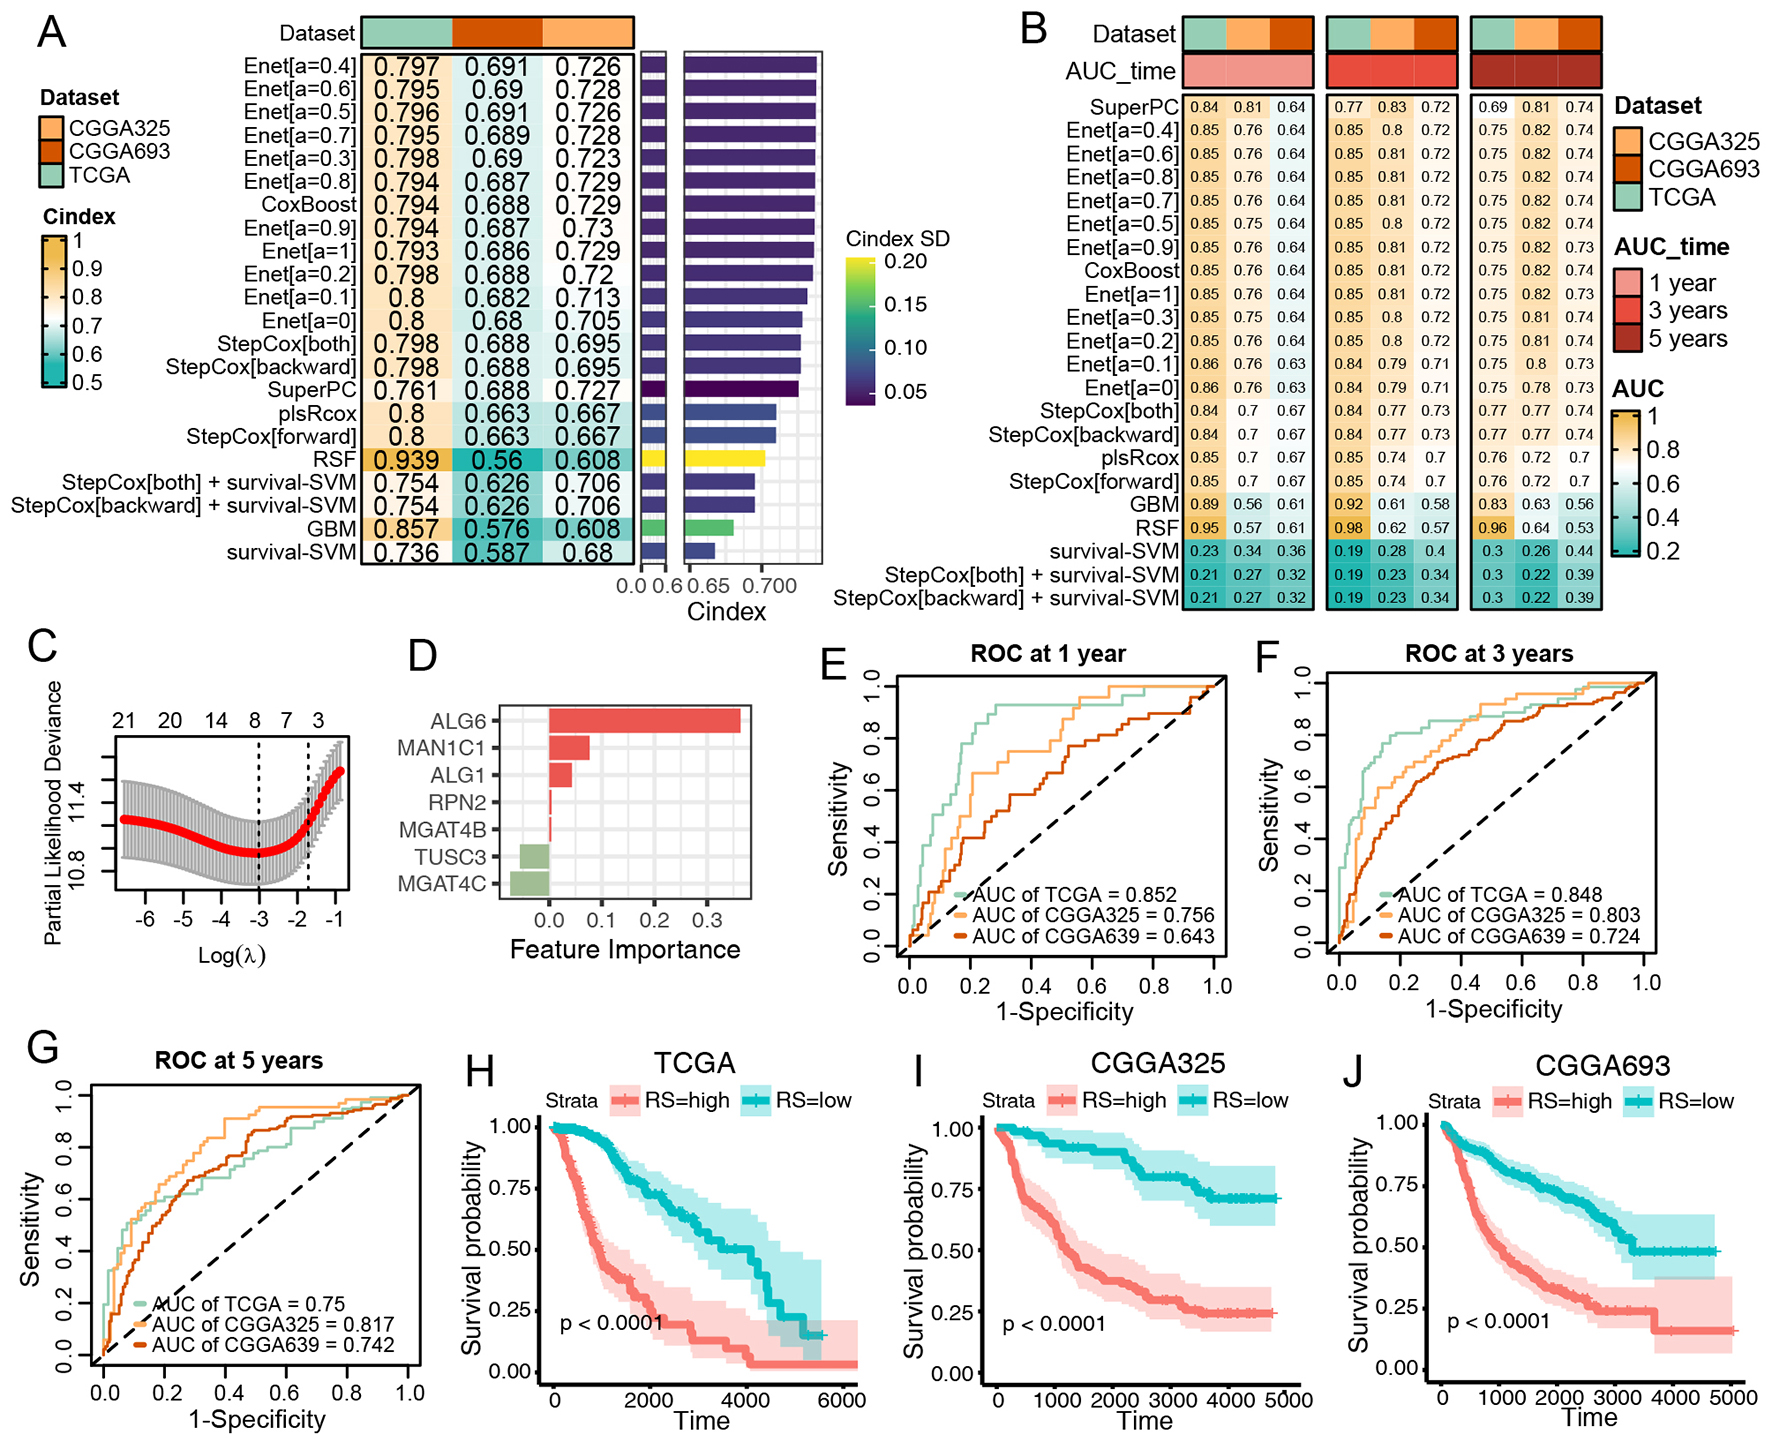
Figure 3. Construction and Validation of N-Glycan Biosynthesis (NGB)-Based Integrated Machine Learning Survival Models. (A) Heatmap displaying the Concordance Index (C-index) of 33 prediction models using Leave-One-Out Cross-Validation (LOOCV) in the TCGA training dataset and two CGGA validation datasets. Mean C-index is presented on the right. (B) Heatmap illustrating the Area Under the Curve (AUC) of 33 prediction models via LOOCV in the TCGA training dataset and two CGGA validation datasets. (C) Plot of Partial Likelihood Deviance against log(lambda) in the Lasso model. Vertical dotted lines indicate lambda values with the minimum error and one standard error (SE) of the minimum. (D) Coefficients of the Lasso model. (E-G) ROC curves at 1, 3, and 5 years for the Lasso model in TCGA (E), CGGA325 (F), and CGGA693 (G). Colors represent the relative time. (H-J) Kaplan-Meier curves for the risk score predicted by the Lasso model in TCGA (H), CGGA325 (I), and CGGA693 (J).


