


fig5
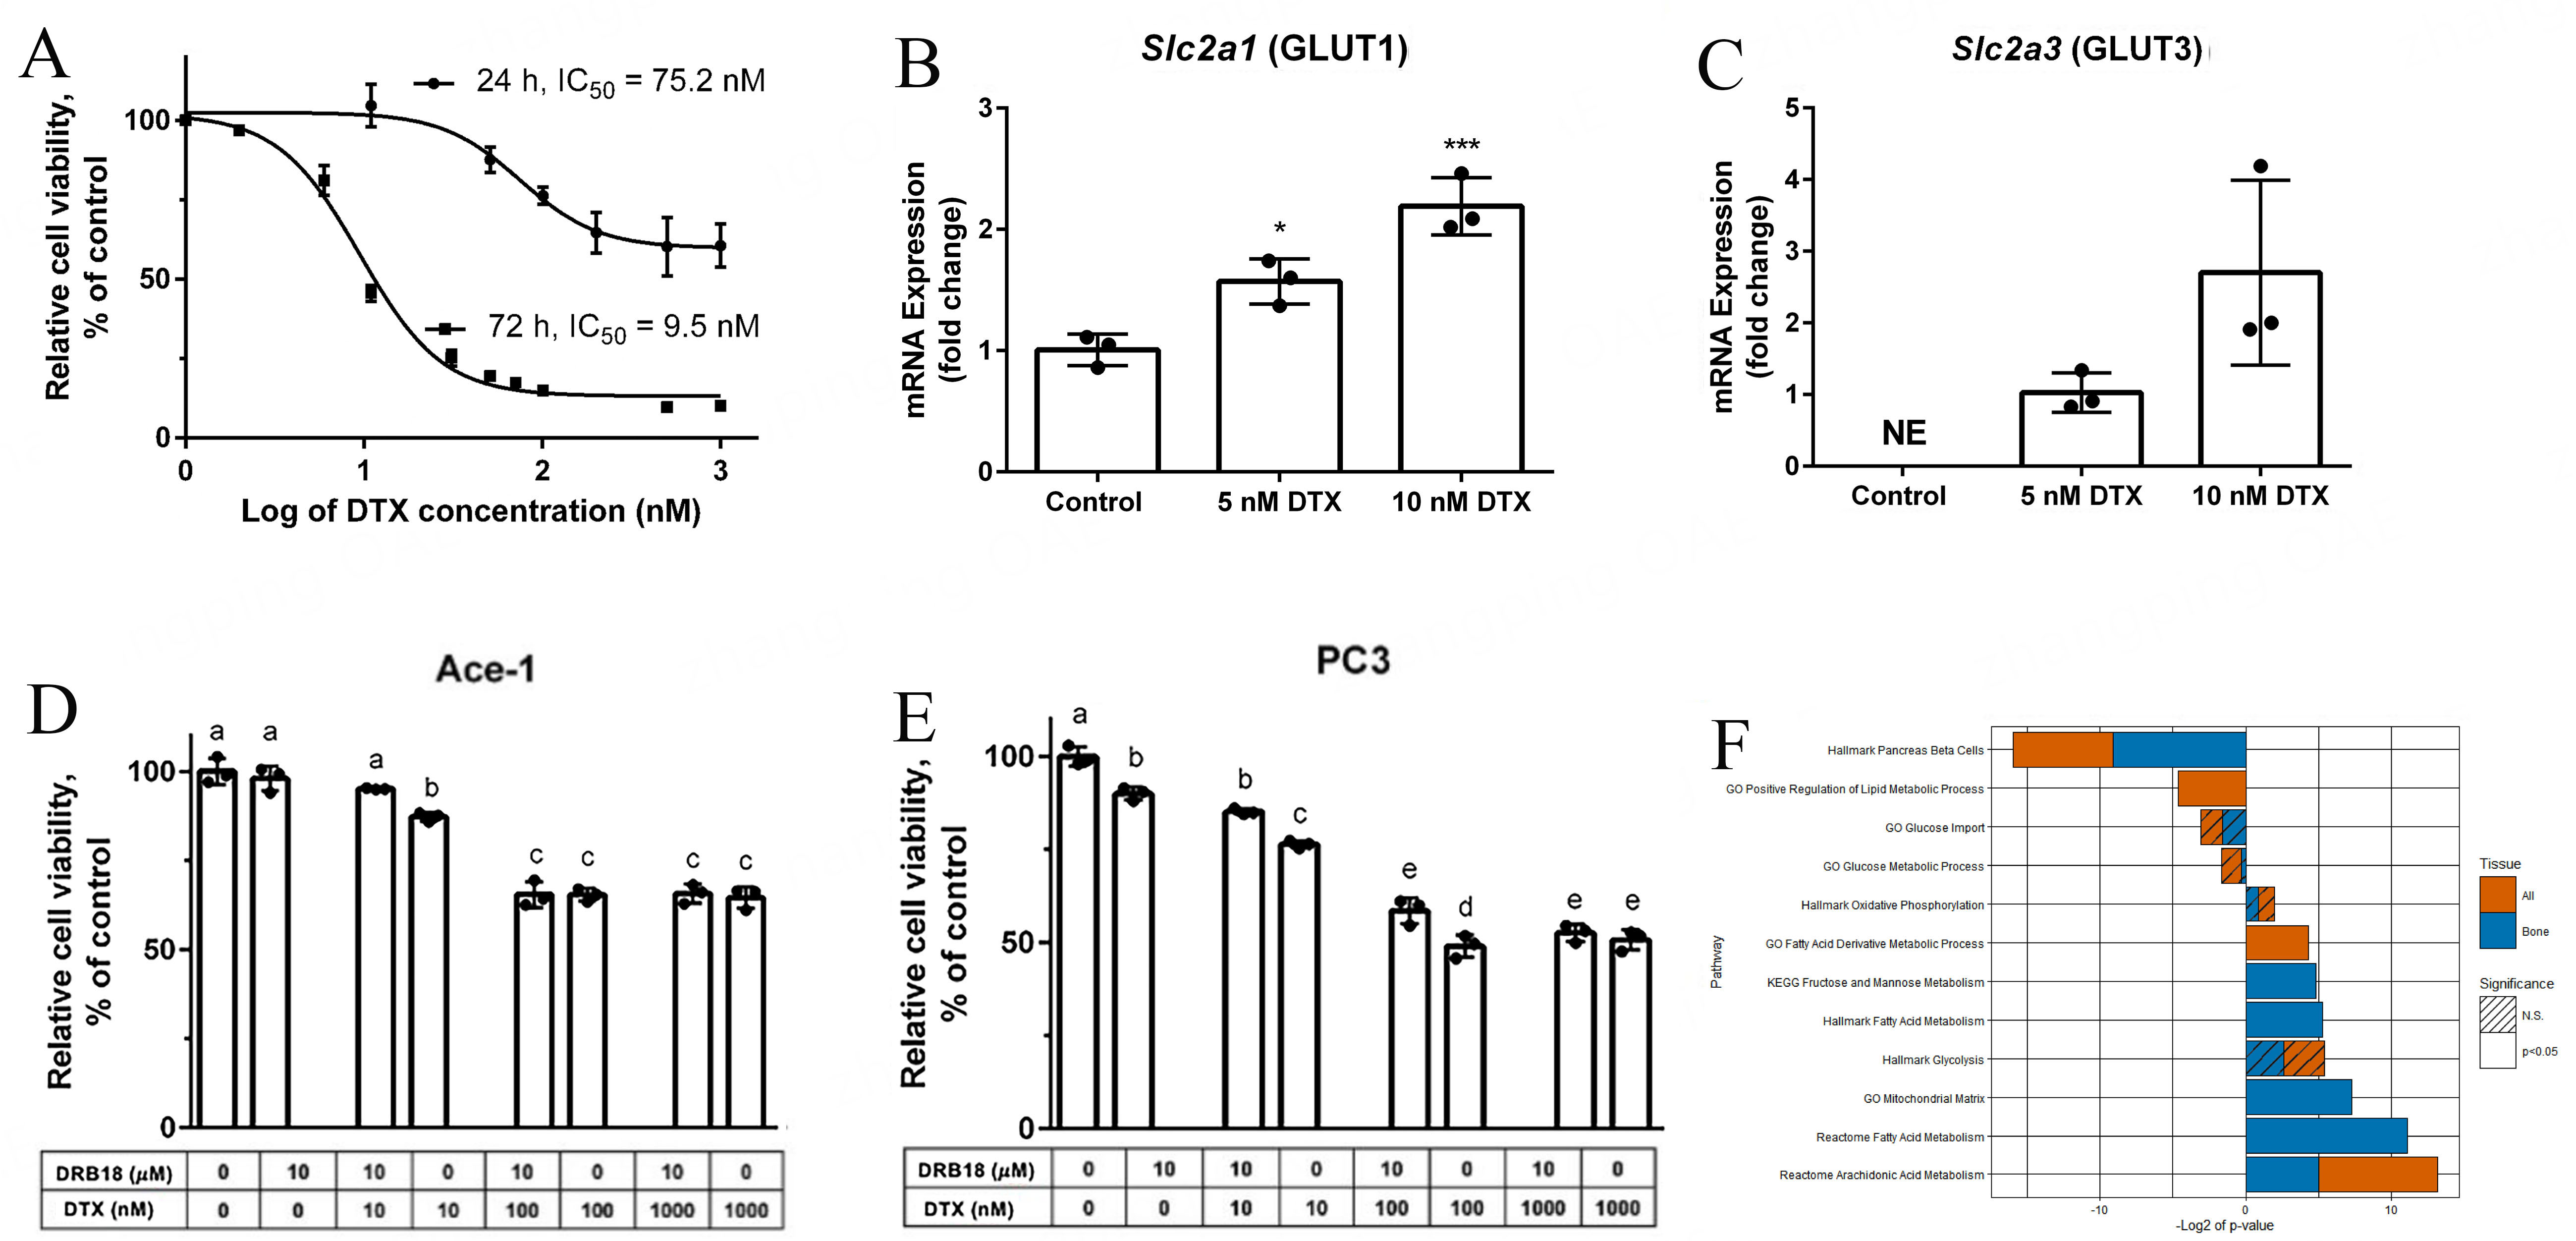
Figure 5. Effect of docetaxel (DTX) on PCa metabolism in vitro and in silico. (A) Dose-response curves following treatment of Ace-1 cells with increasing concentration of DTX for 24 h (top curve) and 72 h (bottom curve); (B and C) Ace-1 cells were treated with increasing concentrations of DTX for 72 h, resulting in increased gene expression of GLUTs 1 and 3 in a dose-dependent manner. One-way ANOVA. Statistical comparisons are between both treated groups and control (0 nM DTX). *P < 0.05; **P < 0.01; *** P < 0.001; (D and E) A combination of DRB18 (10 μM) and increasing DTX concentrations had little to no effect on Ace-1 and PC3 cell viability following 24 h treatment. One-way ANOVA. Different letters indicate statistically significant comparisons (P < 0.05); (F) Gene Set Enrichment Analysis (GSEA) performed on metastatic PCa samples from men treated with or without DTX showed statistically significant changes (solid bars) in some metabolic pathways related to fat and carbohydrate metabolism. Metabolic pathways involving glucose import and metabolism were not significantly altered (striped bars) in either combined (orange bars) or bone-only metastases (blue bars). PCa: Prostate cancer (PCa); GLUTs: glucose transporters.


