fig4

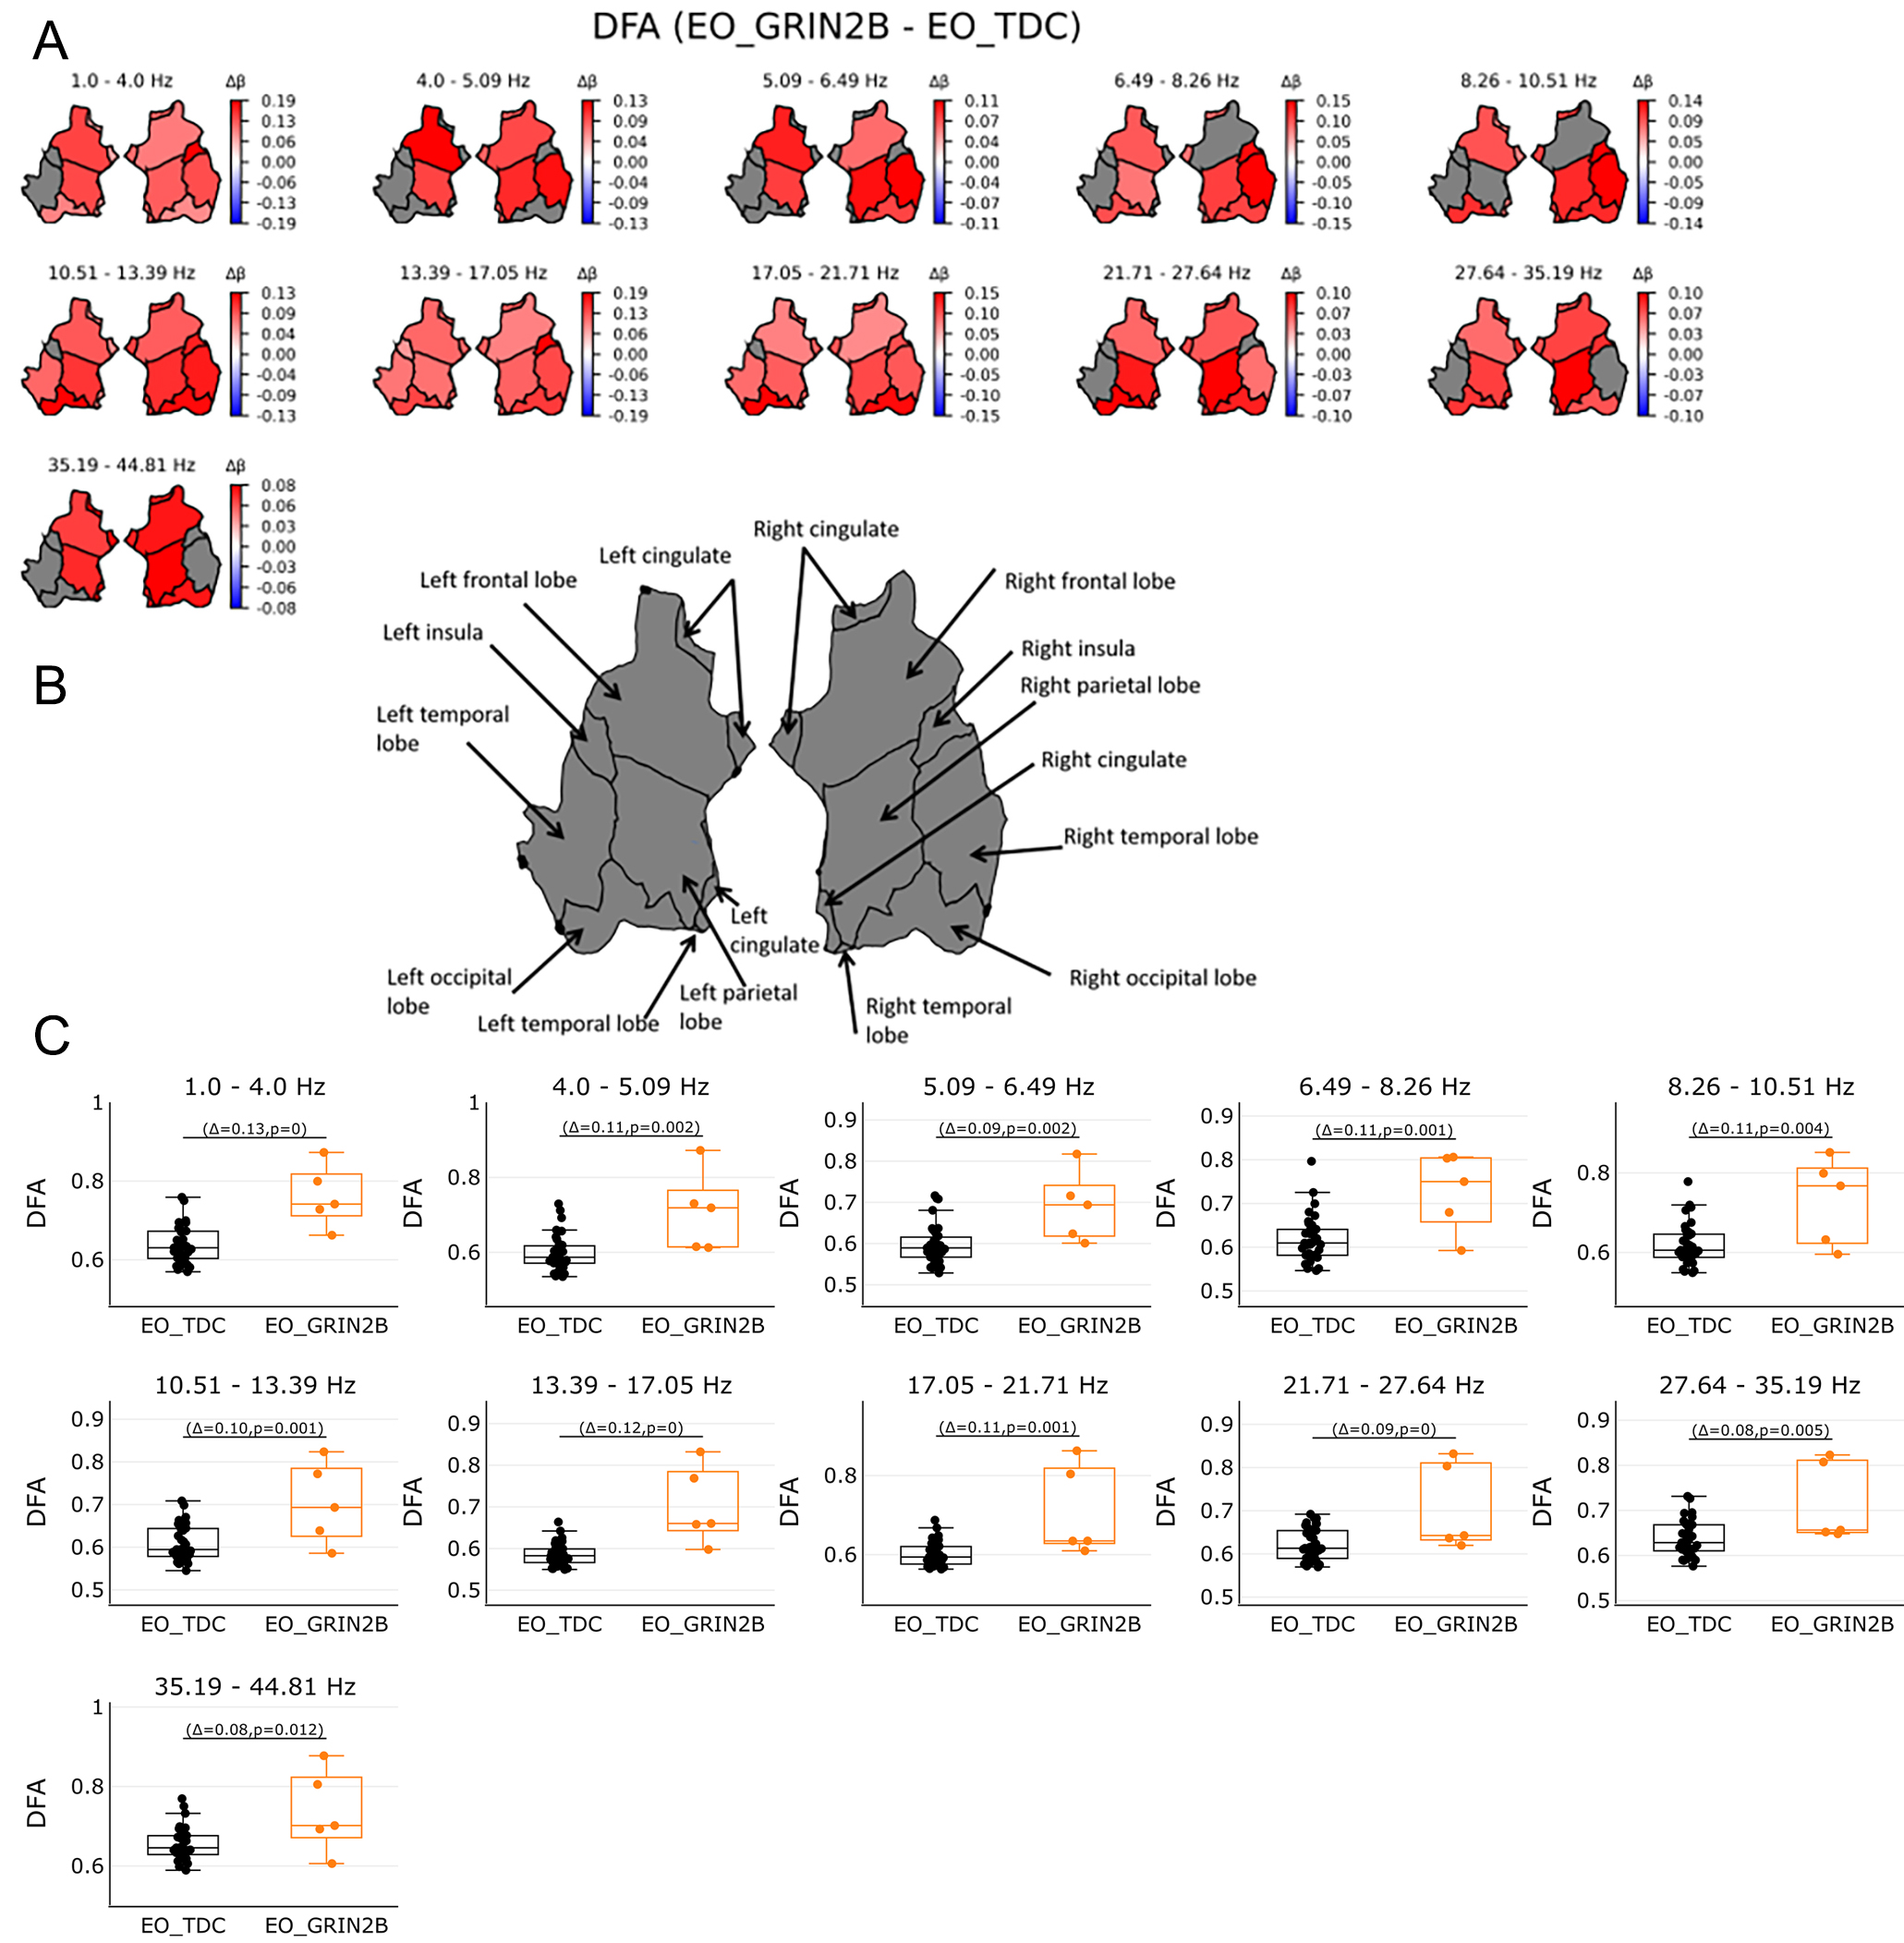
Figure 4. Long range temporal correlations as expressed by DFA in source space in the range of 1-45 Hz. (A) shows DFA values in regions on source level per 11 bins. DFA was averaged across 68 patches of the Desikan Atlas and plotted for 6 regions. Red color shows significant regions for the GRIN2B patients while blue indicates significant regions for the TDC group. Grey areas show no significant results. Bootstrapping analyses were FDR corrected with 0.05. (B) shows an overview of region names. (C) shows the individual values of significant regions in source space per bin. Orange boxplots represent the GRIN2B patients, while black boxplots represent the TDC group with Δ indicting the average group difference with the P value of the significant regions. Whole brain activities for the DFA were most pronounced throughout the brain for the GRIN2B patients, across all bins.


