fig1

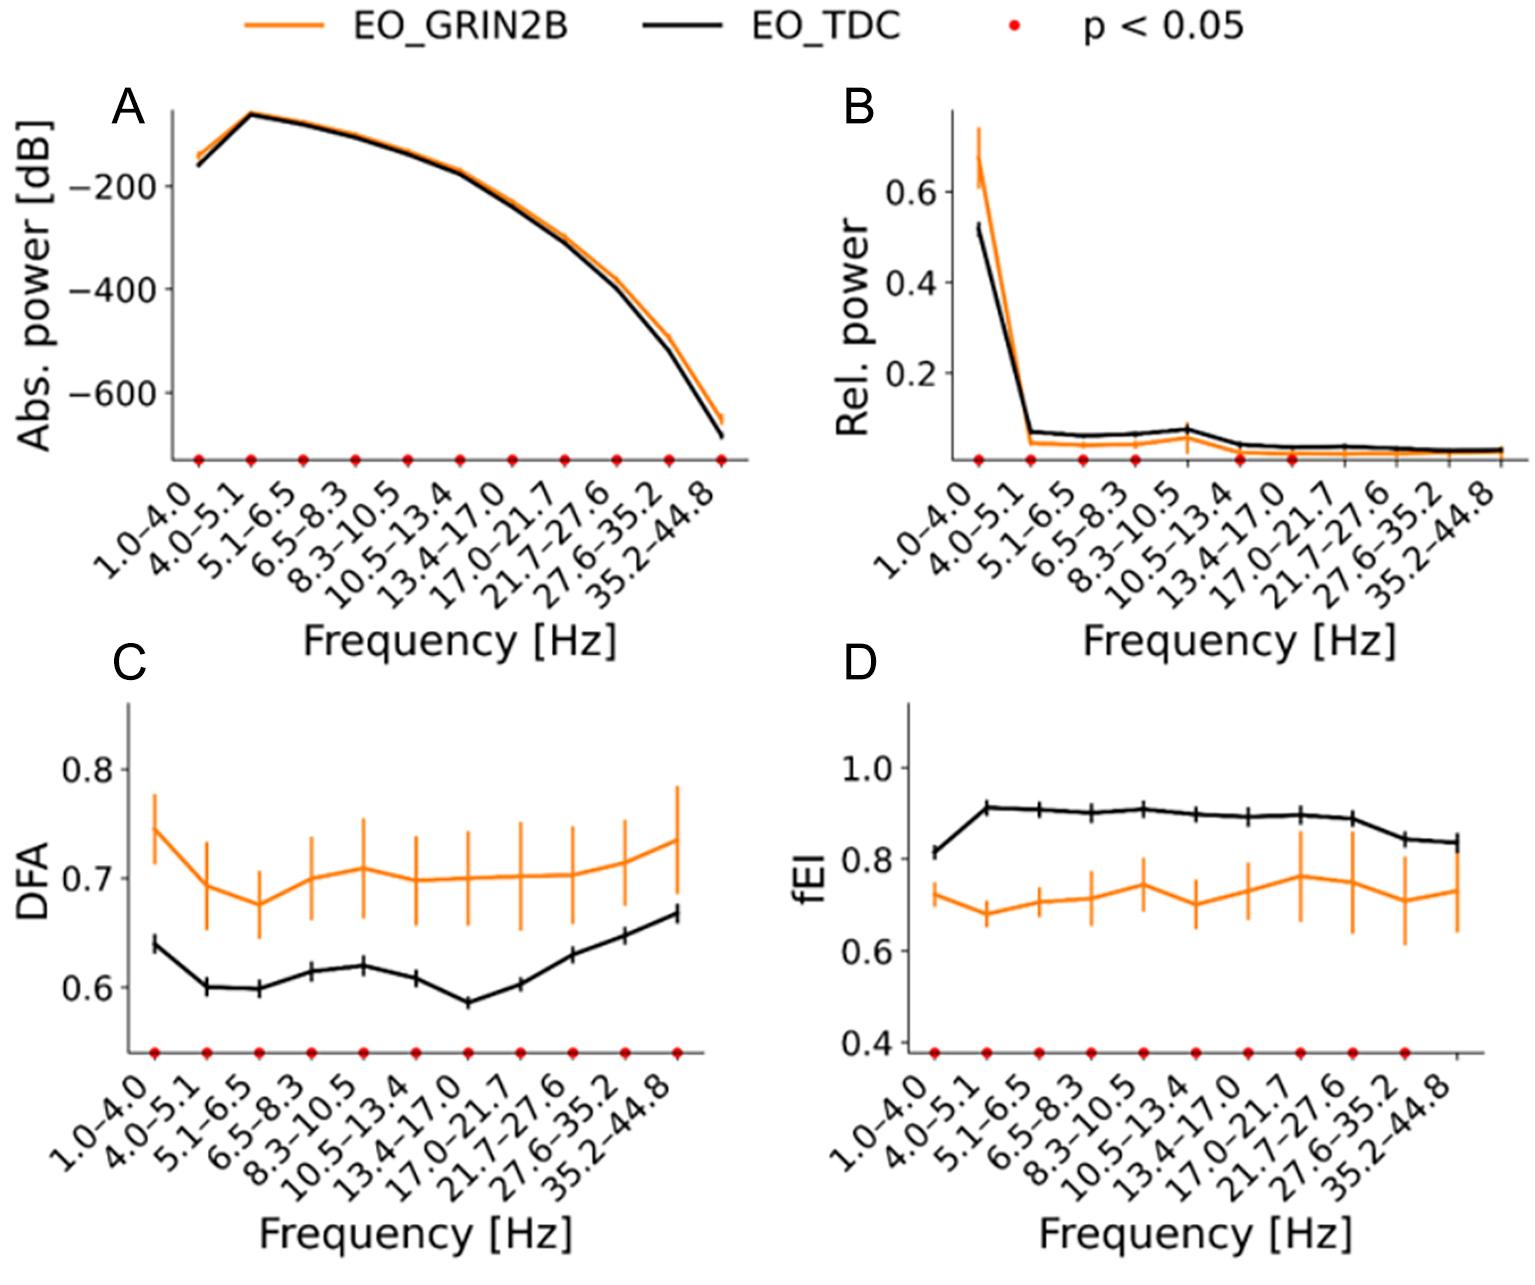
Figure 1. Overview of the qEEG biomarkers of eyes open (EO) resting state in the range of 1-45 Hz in source space. GRIN2B group is plotted in orange while the TDC group is plotted in black. The averaged values with the standard error of the mean are plotted of (A) absolute power in dB, (B) relative power in proportion, (C) DFA and (D) fEl. Bootstrapping analyses were corrected with FDR of 0.05. Significant results are indicated by the red dots. Power effects are mostly found for the lowest to middle oscillations (1-8.3 Hz), In


