


fig5
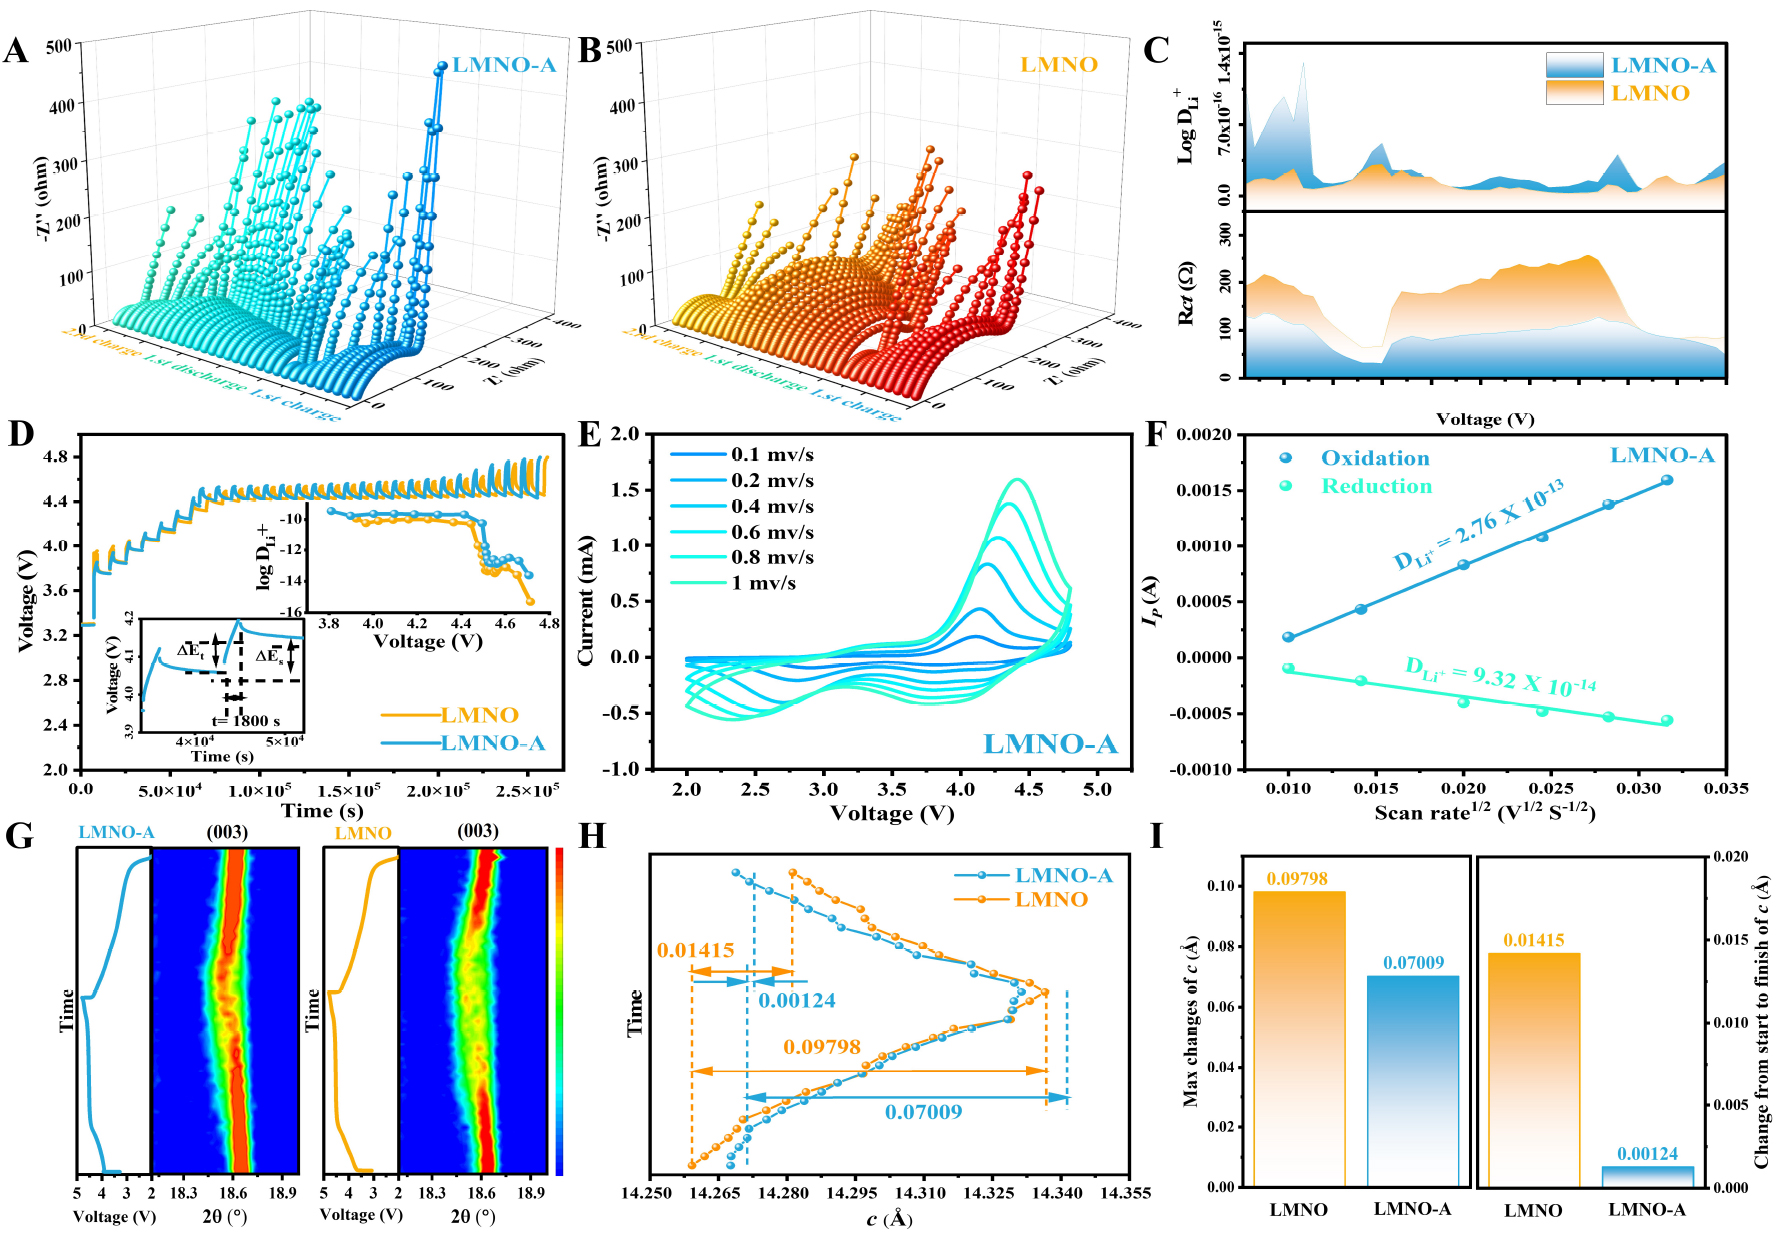
Figure 5. The in-situ EIS results of (A) LMNO-A and (B) LMNO in the first cycle and second charge. (C) The value of DLi+ and Rct of LMNO-A and LMNO in the whole process. (D)The GITT curves and the Li+ diffusion coefficient of LMNO-A and LMNO. The (E) CV curves and (F) Li+ diffusion coefficient for different scan rates of LMNO-A. (G)The in situ XRD patterns about the (003) peak of LMNO-A and LMNO during the first cycle. (H) The changes of c during the first cycle and (I) the corresponding parameter comparisons.


