


fig5
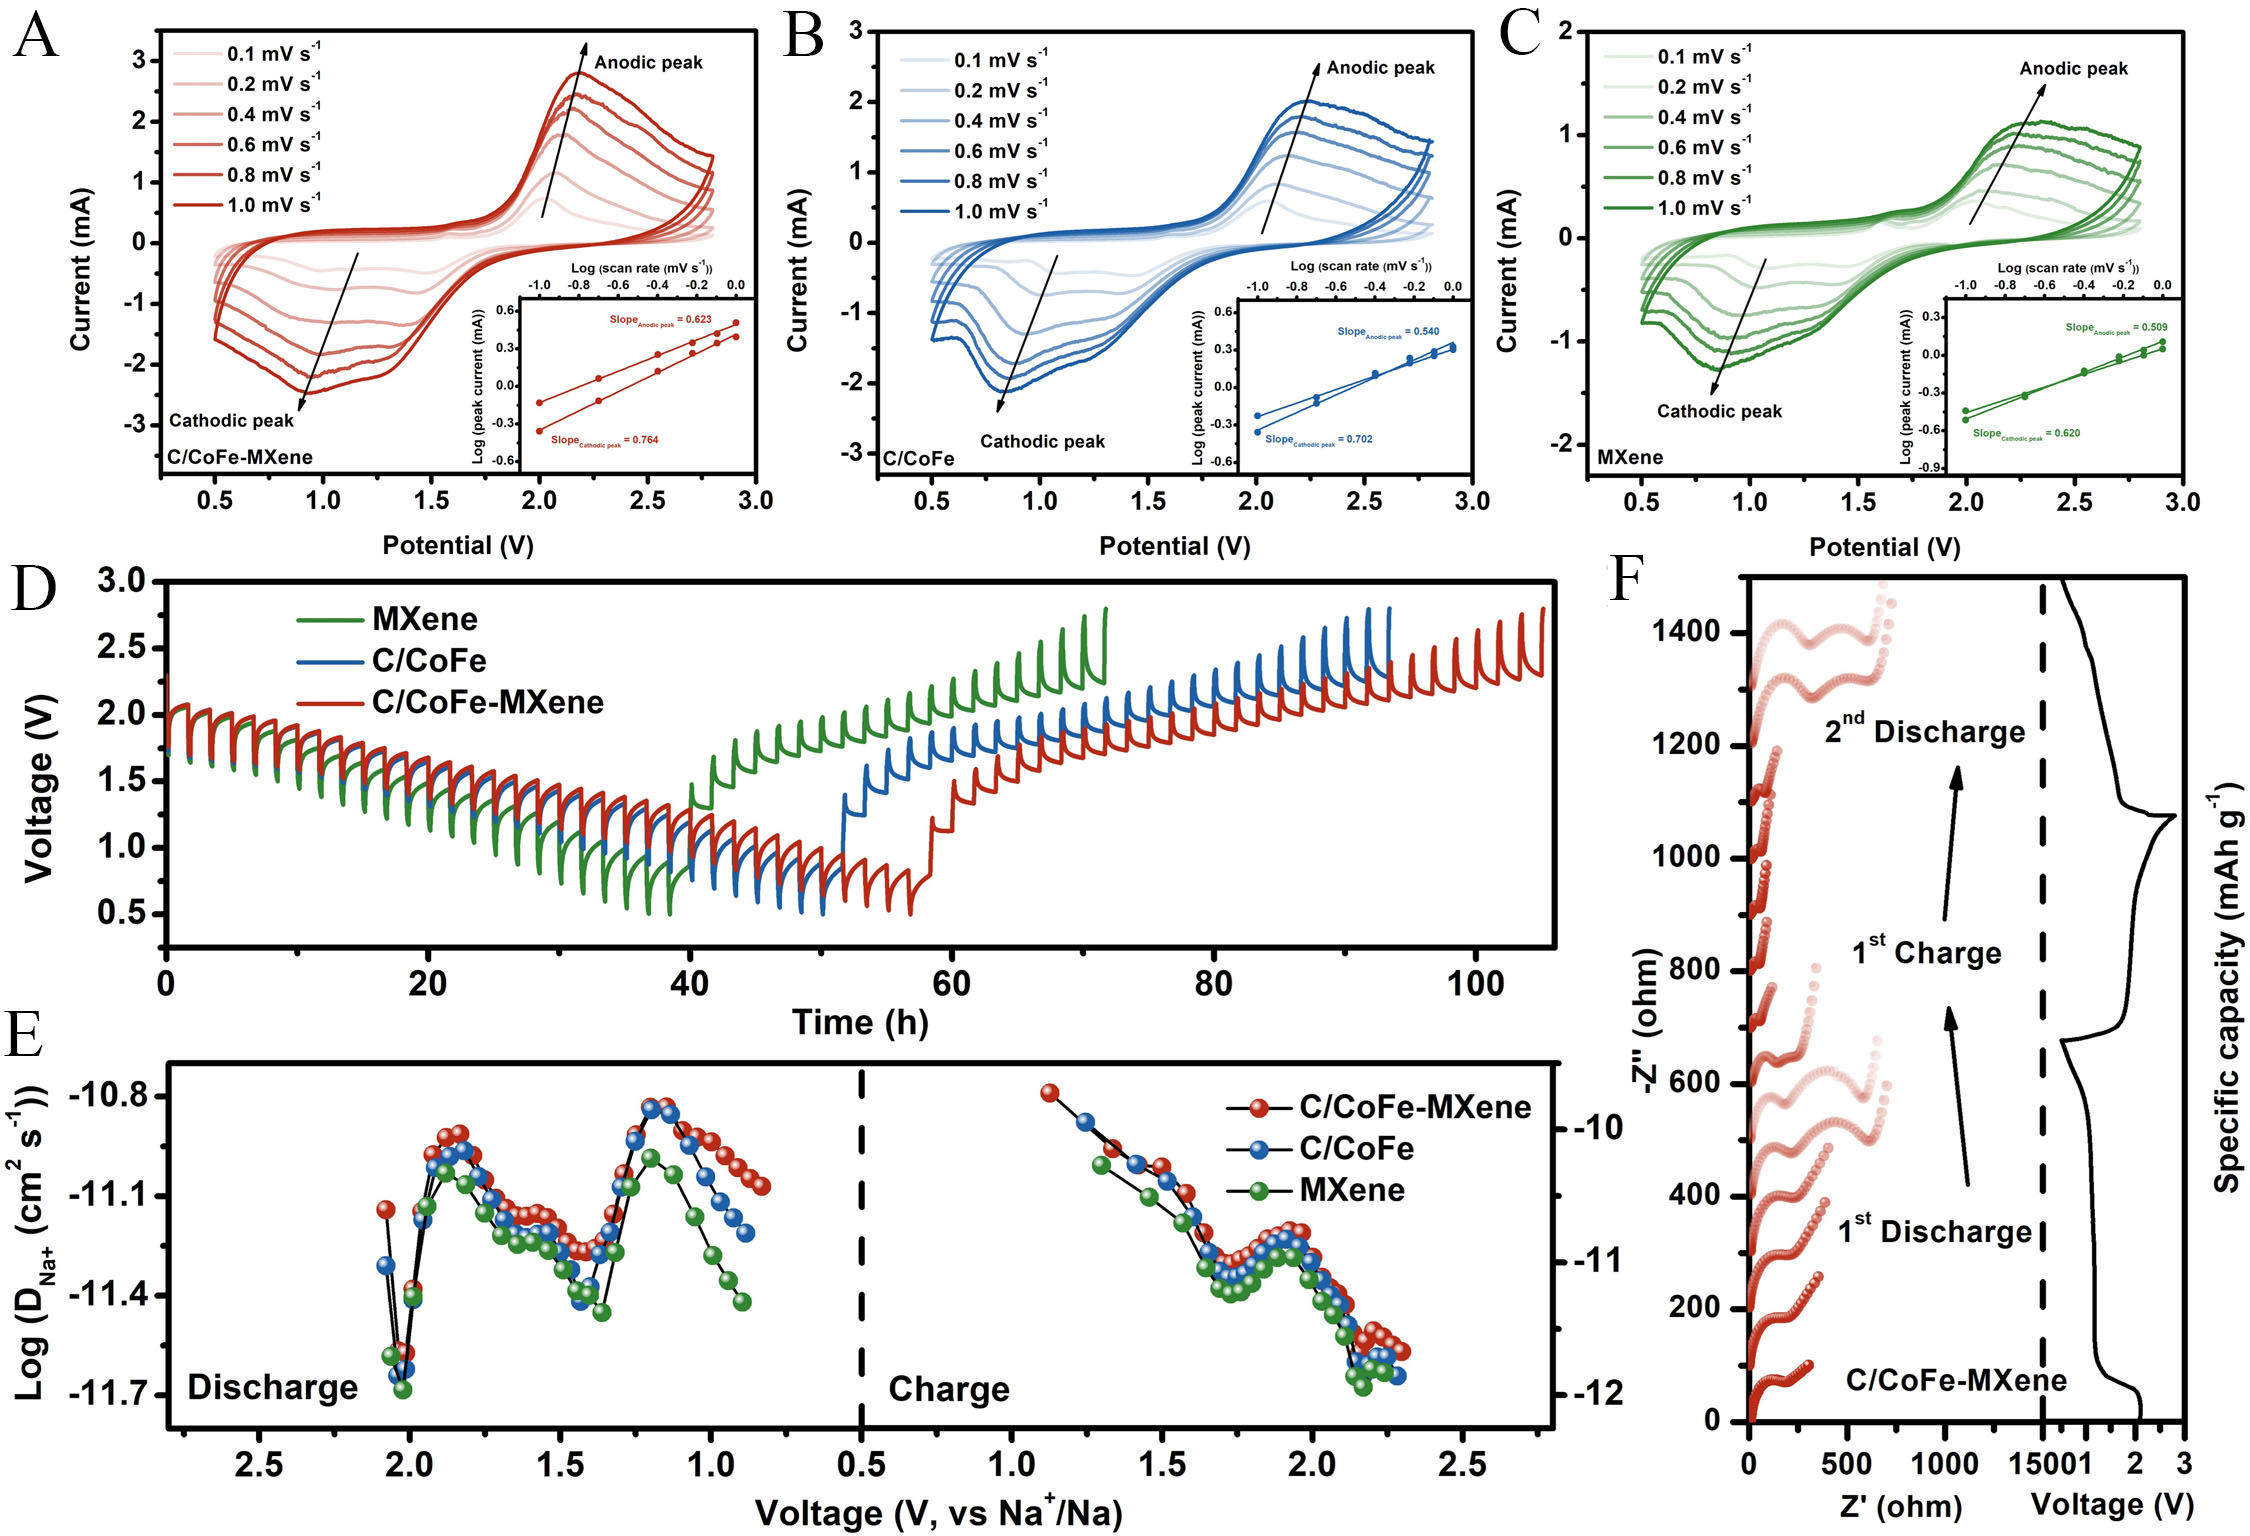
Figure 5. CV curves at different scan rates and corresponding linear fits of the peak current densities (inset) of the cell with (A)
Figure 5. CV curves at different scan rates and corresponding linear fits of the peak current densities (inset) of the cell with (A)


All published articles are preserved here permanently:
https://www.portico.org/publishers/oae/

