


The ion-ion correlations in organic ionic plastic crystal
 0
0 
Abstract
Organic ionic plastic crystals (OIPCs) are emerging as promising electrolyte materials for solid-state batteries. However, despite the fast ionic diffusion, OIPCs exhibit relatively low DC conductivity in solid phases caused by strong ion-ion correlations that suppress charge transport. To understand the origin of this suppression, we performed a study of ion dynamics in the OIPC 1-Ethyl-1-methylpyrrolidinium bis (trifluoromethyl sulfonyl) imide [P12][TFSI] utilizing dielectric spectroscopy, light scattering, and Nuclear Magnetic Resonance diffusometry. Comparison of the results obtained in this study with the published earlier results on an OIPC with a completely different structure (Diethyl(methyl)(isobutyl)phosphonium Hexafluorophosphate [P1,2,2,4][PF6]) revealed strong similarities in ion dynamics in both systems. Unlike DC conductivity, which may drop more than ten times between melted and solid phases, diffusion of anions and cations remains high and does not show strong changes at phase transition. The conductivity spectra in the broad frequency range demonstrate unusual shapes in solid phases with an additional step separating fast local ion motions from suppressed long-range charge diffusion controlling DC conductivity. We suggested that in solid phases, anions and cations can jump only between the specific ion sites defined by the crystalline structure. These constraints lead to strong cation-cation and anion-anion correlations strongly suppressing long-range charge transport.

Keywords
INTRODUCTION
Organic ionic plastic crystals (OIPCs) are a promising class of ion-conducting materials that hold great potential for different energy-related applications. They are found to be suitable for lithium and sodium solid-state batteries[1-4], protic conductive materials[5,6], solar cells[7,8], in the formation of protective solid electrolyte interphase[2], and many other applications[9,10]. One of the advantages of OIPCs in comparison to regular ionic liquids is their ability to remain in solid phases even at very high temperatures[11] and good solubility of different doped salts in solid phases[12-20]. Rational design of new OIPCs with properties required for different applications requires a good fundamental understanding of ion and charge transport in these materials.
One of the most intriguing properties of some OIPCs is the strong decoupling of charge transport and ions self-diffusion in solid phases. The DC conductivity, σDC, (i.e., charge transport) of OIPCs significantly drops at solid-solid or liquid-solid phase transitions, while ion diffusion maintains smooth temperature behavior and remains fast[11,21,22]. The origin of this decoupling is related to the strong ionic correlations in solid phases of OIPCs and characterized by the parameter called ionicity or inverse Haven ratio, H-1[23,24], which shows the difference between experimentally measured σDC, affected by ion-ion correlations and Nernst-Einstein (NE) conductivity, σNE, corresponding to the uncorrelated ions motion[25-28]
Here, n is ion concentration, q is the charge of the ion, ϕ± is a fraction of the mobile ions, and
Among the various hypotheses describing the conductivity mechanisms in OIPCs[29-33], we proposed[21] that in the [P1224][PF6] system, charge transport is fast at short timescales; however, due to ion-ion correlations, charge transport becomes trapped at the length scale of the elementary crystalline unit cell. Our assumption was based on experimental data obtained from a combination of different techniques working in broad timescales, such as Broadband Dielectric spectroscopy (BDS), including GHz frequencies, Light Scattering (LS) and Pulsed Field Gradient Nuclear Magnetic Resonance (PFG-NMR) for diffusion measurements. Unfortunately, [P1224][PF6] has a high melting point (~about 150 °C), making it challenging to measure ion diffusion in a liquid state, and we assumed that ion diffusion is comparable in liquid and solid states based on indirect evidence from BDS and LS spectra. To deepen our understanding of ionic correlations and charge transport in OIPCs, we performed a comprehensive study of a different OIPC [P12][TFSI] system using the same broad set of experimental techniques. This OIPC has a melting temperature of around
EXPERIMENTAL
Materials
1-Ethyl-1-methylpyrrolidinium bis (trifluoromethyl sulfonyl) imide [P12][TFSI] was purchased from Sigma Aldrich [Scheme 1A] and used as received. The structure of Diethyl(methyl)(isobutyl)phosphonium Hexafluorophosphate [P1,2,2,4][PF6] is shown in Scheme 1B for comparison purposes. The samples for all measurements were opened and loaded into cells inside a glove box in an inert atmosphere.

Scheme 1. Chemical structure of two OIPCs: (A) [P12][TFSI] and (B) [P1224][PF6]
Broadband dielectric spectroscopy
Broadband dielectric spectroscopy (BDS) was used to perform conductivity spectra measurements in a broad frequency range from 0.01 Hz up to 50 GHz. To cover the whole wide frequency range, we used the Alpha-A analyzer from Novocontrol for measurements in the frequency range of 10-2 to 106 Hz; an Agilent RF Impedance Material Analyzer, E4991A, with WinDETA Software from Novocontrol, was used in the frequency range 106 to 3 × 10⁹ Hz, and the Panoramic Network Analyzer, Agilent Technologies, E8364C with performance probe and the Agilent Electronic Calibration module for frequency measurements from 5 × 10⁸ Hz up to 5 × 10¹⁰ Hz. The samples were stabilized for 20 min at each temperature to reach a precision of ± 0.2 K. The details of sample cells and calibration procedure can be found in our previous work[21].
Light scattering
Light scattering (LS) was measured using a Raman spectrometer and tandem Fabry-Perot (TFP) interferometer. The experiments were performed in backscattering geometry using a laser wavelength of 532 nm. Three mirror spacings were used in the TFP interferometer: 0.4, 3, and 15 mm to cover the wide frequency range. A T64000 Raman spectrometer from Horiba Jobin Yvon was employed to measure Raman modes for normalization spectra at different temperatures. The temperature was stabilized by a JANIS cryostat with a LakeShore temperature controlling unit. More details about LS can be found in our previous work[21].
Pulsed field gradient nuclear magnetic resonance (PFG-NMR) measurements
Self-diffusion NMR measurements of 1H and 19F in pure OIPCs were conducted using a 300 MHz NMR spectrometer at a magnetic field of 7T with 1H Larmor frequency at 300 MHZ and 19F Larmor frequency at 282.2 MHz. The sample was packed in a 5 mm NMR tube in an Ar-filled glovebox and placed in a DOTY Z-spec pulse field gradient (PFG) NMR probe. It was then melted in-situ at 100 °C and subsequently cooled to room temperature to remove thermal history. Measurements were then performed as temperature was increased to 65, 75, 90, and 95 °C. A spin-echo pulse sequence was used and self-diffusion coefficients were calculated by using the Stejskal-Tanner equation: S = S0 exp[-D(γgδ)2 (Δ - δ/3)]. Gradient field strength (g) varied between 10-900 G/cm for 16 increments. Gradient pulse duration (δ) ranged from 2-3 ms and diffusion time (Δ) covered a range from 10-20 ms. Relaxation delay times ranged from 8-17 s to accommodate T1 relaxation times. Acquisition times spanned from 10-100 ms. To improve signal-to-noise ratios, spectra were signal-averaged using 4-40 scans. Convection in the liquid phase at higher temperatures was suppressed by limiting the sample height in the NMR tube to 1 cm and adding small pieces of quartz to break up convection cells. It is worth noting that PFG-NMR measures diffusion on the micrometer scale. See Supplementary Material for additional details about spectra analysis
Wide angle X-ray scattering
Wide Angle X-Ray Scattering (WAXS) experiments were carried out on a Xenocs Xeuss 3.0 instrument with both fresh and aged samples of [P12][TFSI]. The solid samples were ground, placed in hermetic Al pans, and aligned perpendicular to the direction of the X-ray beam (transmission mode). The samples were then heated up to 50 °C and equilibrated for 10 min. Next, data were collected for 6 min followed by a 6-min interval with the X-ray beam switched off to avoid overheating the samples. This procedure was repeated three times, and the results of the runs were averaged for better statistics. An additional run was performed with the fresh [P12][TFSI] at 100 °C to obtain the structure factor of the liquid phase.
EXPERIMENTAL RESULTS
BDS
BDS measurements provide important information about charge transport in a wide time/frequency scale in ion conductive systems. Conductivity spectra of [P12][TFSI] measured by BDS in different solid phases and the melt state are presented in Figure 1A. The spectra of [P12][TFSI] melt resemble those of regular ionic liquids, with the AC-tail at high frequencies crossing over to the DC regime. At lower frequencies, conductivity drops because of the electrode polarization effect[34]. The AC-DC crossover is well described by Random Barrier Model (RBM)[35,36]. According to this model, the AC-tail is associated to the sub-diffusion ion regime, where ions rattle in Coulombic cage created by surrounding ions. Low-frequency DC regime defines σDC and corresponds to normal diffusion regime when the ion escapes from the Coulombic cage overcoming the highest potential barrier. The timescale, when ion diffusion behavior changes from sub-diffusion to normal diffusion regime, is defined by conductivity relaxation time, τσ, and can be estimated from the crossover frequency τσ = 1/(2πfAC-DC). More accurately, τσ can be obtained from the fit of the conductivity spectra to the equation derived by RBM[35,36]

Figure 1. (A) Conductivity spectra of [P12][TFSI] in different solid phases and melt states. In the melted state, only standard AC-DC crossover is observed. In the solid phases, the additional step at high frequency is presented (Process I). Red solid lines correspond to RBM and obey Eq. (2). (B) Temperature dependence of DC conductivity estimated at low-frequency DC plateau after Process I. Colored symbols (red and blue) correspond to DC conductivity of the fresh sample from (A). The black symbols correspond to the aged sample measured with a 1K degree step around phase transitions.
The red lines in Figure 1A correspond to Eq. (2) and show a reasonable fit for the melted state. In solid phases, [P12][TFSI] shows an additional step in conductivity spectra. This step becomes more pronounced with a decrease in temperature. A similar effect was previously observed in another OIPC [P1224][PF6] and this step was called Process I[21]. This additional step leads to a significant drop of σDC. The temperature dependence of σDC is presented in Figure 1B. It was demonstrated earlier[17] that for this OIPC, the temperature dependence of σDC is not well reproducible, which is most probably related to the aging effect or thermal history. We repeated the conductivity measurements of our fresh sample after a few months, and indeed observed the same effect. The solid-phase σDC is higher for the aged sample, although the conductivity remains the same in the melt [Figure 1B]. It remains higher in the aged samples even after many melting cycles, and our data for fresh and aged samples agree well with previously published data[17]. Based on our WAXS data shown below, the difference in conductivity for fresh and aged samples might be related to the decreasing crystallinity degree for long-stored samples (aged). The crystalline structure becomes more disordered with time and cannot be restored by melting.
Ion diffusion
Unlike BDS techniques, which measure conductivity including contributions from both ions and provide information about self and cross-correlations of ion transport, the PFG-NMR technique measures only ion self-diffusion and distinguishes the type of ion species. In previous studies of OIPC [P1224][PF6], we could not measure the diffusion coefficient in the melt due to its very high melting temperature. The [P12][TFSI] studied here has a melting temperature of around 80 °C, which is accessible for PFG-NMR equipment. The temperature dependencies of cation and anion diffusion are presented in Figure 2 and

Figure 2. Temperature dependence of anion and cation diffusion coefficients and DC conductivity of the aged [P12][TFSI] sample in the solid and melted states.
LS
LS provides information about structural relaxation at high frequencies, related to the fluctuation of polarizability. The LS spectra of [P12][TFSI] in the melted and solid Phase I state are shown in Figure 3. The melted state spectrum shows a clear relaxation process, while in the solid phase, additional Brillouin lines are presented. Polycrystallinity of the solid state leads to multiple light scattering that destroys the angle selection rule, and Brillouin lines appear as multi-peak structures. However, at lower and high frequencies, we can still detect the shoulder of the relaxation process and can estimate its position. We used Cole-Davidson function to fit the relaxation processes and relaxation time can be estimated as τLS = 1/(2πfmax). The relaxation process in LS is associated with the structural dynamics, and our estimations give that characteristic relaxation time of ~0.02 ns for a melted state and 0.01 ns for a solid state. These times correspond to τσ, extracted from the AC-DC crossover in conductivity spectra. At the same time, no signature of Process I is observed in the LS spectra.

Figure 3. Light Scattering spectra of OIPC [P12][TFSI] in melted (95 °C) and solid state, Phase I (85 and 65 °C). The relaxation peaks were fitted with Cole-Davidson function (solid lines) and relaxation times were estimated from maximum of the relaxation peak.
WAXS measurements
WAXS measurements provide information about structure of the material. Figure 4A shows the WAXS results obtained with the fresh [P12][TFSI] sample. The black curve shows the data collected at 50 °C whereas the blue line depicts the data collected at 100 °C. Thus, while the latter shows the structure factor of the liquid, the former comprises a mixture of crystalline and disordered phases. By scaling the data from the liquid state using the intensity of its main peaks at Q ~ 1 Å-1 to match the intensity of the shoulders at the correspondent values of Q in the data collected at 50 °C, we can subtract the contributions of the disordered phase to obtain a diffraction pattern from the crystalline phase within the sample, as shown by the pink dashed line [Figure 4A]. Then, by scaling the liquid and crystalline standards to match the experimental data (red dotted line), the weight fraction of crystalline, Wc, and disordered, WD, phases were estimated using

Figure 4. WAXS results obtained at 50 °C (black lines) for the (A) fresh and (B) aged samples of [P12][TFSI]. In (A), data collected at 100 °C is also presented (blue line), along with the pattern of the pure crystalline phase (pink dashed line) obtained as described in the text. The red dots in (A and B) depict the scaled sum of the liquid and crystalline spectra.
where Sc and SL are the scale factors for the crystalline and liquid phases, and Z, M, and V are the number of chemical formulas per unit cell, the molecular weights of these unit cells, and their respective volumes, respectively[37,38]. For simplicity, we consider that (ZMV)C = (ZMV)L. In the fresh sample, WD ≈ 19%. Next, the previously obtained standards for the liquid and crystalline phases were used to determine the weight fractions of the phases in the aged sample [Figure 4B]. In this case, WD ≈ 50%. One should notice that, with the considerations made in this work, these weight fractions are not absolute values and must be analyzed as a qualitative comparison between the samples, suggesting that the aged sample has a ~2.5 times higher fraction of the disordered state.
DISCUSSION
Based on the presented experimental data of [P12][TFSI] and our previously published results obtained for [P1224][PF6], where we performed a similar study[21], we can derive the common pattern about ion dynamics in these OIPCs. Figure 5 presents the conductivity and LS spectra of the melted and solid phases. As mentioned above, the AC-DC crossover or τσ defines the timescale where ions escape from the cage of surrounding ions and start the normal diffusion regime. In the conductivity spectra, it results in formation of the σDC plateau, and the melt phase demonstrates this typical behavior (upper panels in Figure 5).

Figure 5. Comparison of LS and conductivity data for two OIPCs [P12][TFSI] and [P1224][PF6] (data taken from[21]) in melted and solid states. A similar pattern is observed in both OIPCs: The position of relaxation processes in LS coincides with AC-DC crossover, while Process I is not observed in LS spectra.
However, in the solid phase, the initial high-frequency plateau is terminated by Process I, and the second low frequency plateau is formed with lower σDC. The relaxation process observed in the light scattering spectra corresponds to the structural relaxation and can be associated with the same time of local ion rearrangements (escape from the cage), τLS. The light scattering relaxation processes for solid and melt phases have almost the same positions and coincide with the high-frequency AC-DC crossover in both OIPCs, which indicates that local ionic mobility is comparable in liquid and solid phases. Howver, unlike the melt state, there is a mechanism of charge trapping in the solid phases, appearing as Process I. At the same time, there is no signature of this process in LS spectra. It might be explained by charge trapping leading to formation of large dipole moment. The dielectric response is proportional to the square of the dipole moment fluctuation, and therefore, this charge trapping appears as strong Process I. However, this process involves many individual ion jumps. In contrast, light scattering is sensitive to fluctuations in polarizability and is insensitive to dipole reorientation. As a result, LS detects individual ion jumps, but not the charge trapping process.
The high ionic mobility indicated by the BDS and LS spectra is validated by direct measurements of the cation and anion diffusion coefficients in the liquid and solid phases by PFG-NMR. Both cation and anion self-diffusion coefficients show no sharp changes at the melt-solid phase transition in both OIPCs, while σDC, defined by the low-frequency DC plateau (after Process I), drops significantly [Figure 2]. However, there are important differences between [P12][TFSI] and [P1224][PF6] data. First, unlike the [P1224][PF6], where all ions are mobile in Phase I[11,21], only around 20% of cations and anions are mobile
where q and
where V is volume. Separating self and distinct correlations in Eq.(5) we can write the σDC as[21,22,39-41]
where the first term is defined by Eq. (1) and the last three terms correspond to distinct cation-anion, cation-cation and anion-anion correlations. Thus, the experimentally measured σDC will coincide with the
Using the experimental values of σDC, mobility fraction [Supplementary Figure 2B] and diffusion coefficient [Figure 2] can estimate the contribution of distinct ion-ion correlations. The ionicity of regular ionic liquids is always less than one[23,42-47], and as molecular dynamic simulations[39] and experiments in molten salts[48-50] showed, it is mostly caused by the negative distinct anion-anion and cation-cation correlations
Figure 6 presents the temperature dependence of the inverse Haven ratio for [P12][TFSI] and [P1224][PF6] in Phase I and melted states. We can see that in the melt state, H-1 is in the range of 0.4-0.8 which is typical for ionic liquids and molten salts[23,42-47], where the values H-1 < 1 are explained by the negative distinct anion-anion (

Figure 6. Temperature dependence of inverse Haven ratio for two OIPCs [P12][TFSI] and [P1224][PF6] (data taken from[21]) in melted and solid states. The large error bars come from the uncertainties in estimation of mobile fraction [Supplementary Figure 2B].
In our previous work[21], we suggested that there are two types of ion transport in plastic crystal [P1224][PF6] in the solid phase: intra-cell and inter-cell motion. At the small intra-cell scale, ion transport is similar to regular ionic liquid and appears as the highfrequency AC-DC crossover in the conductivity spectra and as the relaxation process in the LS spectra. Larger scale inter-cell dynamic corresponds to the ion exchange between the crystalline cells. We speculated that the inter-cell ion transport appears strongly correlated, possibly due to ion momentum conservation or elementary cell charge neutrality[21]. This correlation leads to a kind of backflow - when one cation or anion leaves the elementary unit cell, another cation or anion should enter to compensate for either the overall charge of the cell or the momentum of the departing ion. Thus, ions show high mobility, but charge transport is trapped at the scale of the elementary unit cell.
Based on common patterns of experimental data, we may propose that a similar scenario of charge trapping occurs in [P12][TFSI], but with slight modification. Our WAXS and NMR data show that there are crystalline and disordered fractions in [P12][TFSI] and that about 80% of ions are immobile in Phase I. We may assume that the ordered crystalline fraction consists of relatively immobile ions, but anions and cations have high mobility in the disordered fractions [Figure 7]. However, there is additional suppression of charge transport in the disordered solid fractions due to strong ion-ion correlations resulting in Process I.
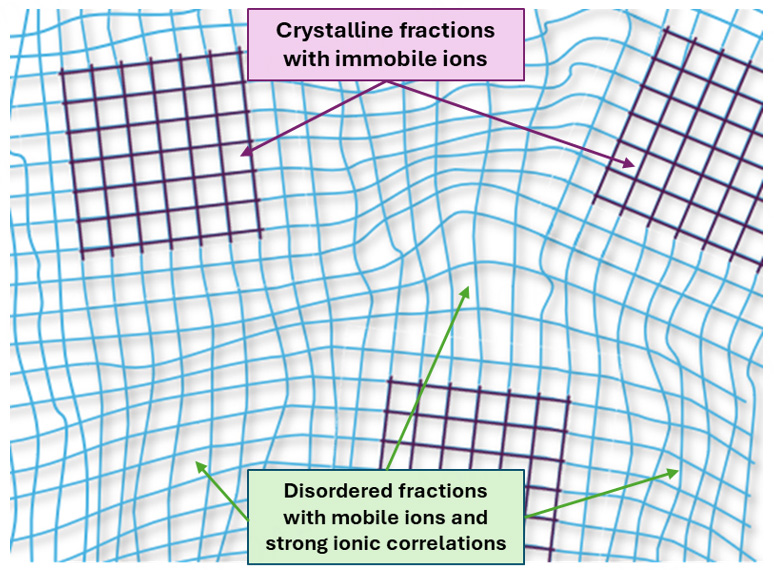
Figure 7. Schematic presentation of OIPC consisting of crystalline fraction with relatively immobile ions and disordered fraction with high mobile ions, but with strong ion-ion correlations.
We propose that because of the crystalline structure of OIPCs (although disordered), cation motion occurs only through jumps between cation sites, while anions can only jump between anion sites. This might create cooperative jumps where cations exchange positions with other cations and anions with other anions, leading to high ion diffusion without contributing to long-range charge transport. Such ion exchange motion can be considered as dynamical charge trapping, appearing as Process I in conductivity spectra. In this scenario, the scale of cooperativity might exceed the size of the elementary unit cell, as previously proposed[21], and probably depends on the structure of solid phases at different temperatures. As mentioned above, according to our WAXS data, the aged sample exhibits a more disordered crystalline structure with a higher fraction of mobile ions, which might explain why the aged sample has higher conductivity compared to the fresh sample.
CONCLUSIONS
We investigated ion dynamics in the plastic crystal [P12][TFSI] across a broad frequency and temperature range, and compared it with [P1224][PF6] from our previous study[21]. Despite the completely different chemical structures of these OIPCs, we observed strong similarities in ion dynamics in both systems and hypothesize that the proposed scenario of the charge trapping might be common across all OIPCs. In melted states, both systems present the behavior of regular ionic liquids with a single AC-DC crossover in conductivity spectra and one relaxation process in light scattering corresponding to the ion rearrangement. The conductivity of the melts appears to be ~2 times lower than expected from the NE equation, which is consistent with typical ionic liquids. However, in the solid phases, both systems exhibit significant suppression of σDC, despite the small changes in cation and anion diffusion between phases. Although NMR data also suggest a drop in mobile fraction of ions in the solid phase of [P12][TFSI], this drop is not sufficient to explain the observed drop in conductivity. Meanwhile, the conductivity and light scattering spectra indicate that at short timescales, ion dynamics are similar to those in ionic liquids, and conductivity suppression happens at nm length scale. We suggested that observed drop of σDC in solid phases of OIPCs is related to strong ion-ion correlations. Crystalline structures of OIPCs (although disordered) lead to the effect that anions and cations can transfer only through the specific ion sites resulting in circulating ion motions without significant charge transport. In turn, it leads to high ion mobility but reduces long-range charge transport and low σDC. Additionally, the ion transport occurs only through the disordered fractions. In the low-temperature solid phases, the portion of the ordered crystalline fractions increases, leading to the reduction of the mobile ions and additional suppression in ionic conductivity. Thus, to increase the overall conductivity of the plastic crystal, the crystallinity and ionic correlations should be suppressed. One possible approach is doping OIPCs with a small amount of salt, as demonstrated in[17]. However, further comprehensive studies are needed to identify the exact mechanism by which salt doping increases conductivity.
DECLARATIONS
Authors’ contributions
Conductivity measurements: Ahmed, M. D.; Abdullah, M.; Popov, I.
Light scattering measurements: Abdullah, M.; Singh, H.; Popov, I.
PFG-NMR measurements: Zheng, A.; Greenbaum, S.
WAXS measurements: Martins, M. L.; Ahmed, M. D.
Idea development and research supervision: Popov, I.; Sokolov, A. P.
Discussion of the results: Ahmed, M. D.; Martins, M. L.; Abdullah, M.; Singh, H.; Zheng, A.; Greenbaum, S.; Sokolov, A. P.; Popov, I.
Availability of data and materials
The data supporting the plots and findings in this study are available from the corresponding author upon reasonable request.
Financial support and sponsorship
This work was supported by the National Science Foundation (awards CHE-2102425 and CHE-2417963). The NMR measurements at Hunter College were supported as part of the Breakthrough Electrolytes for Energy Storage (BEES), an Energy Frontier Research Center funded by the U.S. Department of Energy, Office of Science, Basic Energy Sciences under Award #: DE-SC0019409.
Conflicts of interest
All authors declared that there are no conflicts of interest.
Ethical approval and consent to participate
Not applicable.
Consent for publication
Not applicable.
Copyright
© The Author(s) 2025.
Supplementary Materials
REFERENCES
1. Macfarlane, D. R.; Forsyth, M.; Howlett, P. C.; et al. Ionic liquids and their solid-state analogues as materials for energy generation and storage. Nat. Rev. Mater. 2016, 1, 20155.
2. Thomas, M. L.; Hatakeyama-Sato, K.; Nanbu, S.; Yoshizawa-Fujita, M. Organic ionic plastic crystals: flexible solid electrolytes for lithium secondary batteries. Energy. Adv. 2023, 2, 748-64.
3. Basile, A.; Hilder, M.; Makhlooghiazad, F.; et al. Ionic liquids and organic ionic plastic crystals: advanced electrolytes for safer high performance sodium energy storage technologies. Adv. Energy. Mater. 2018, 8, 1703491.
4. Makhlooghiazad, F.; Gunzelmann, D.; Hilder, M.; et al. Mixed phase solid-state plastic crystal electrolytes based on a phosphonium cation for sodium devices. Adv. Energy. Mater. 2017, 7, 1601272.
5. Zhu, H.; Rana, U. A.; Ranganathan, V.; et al. Proton transport behaviour and molecular dynamics in the guanidinium triflate solid and its mixtures with triflic acid. J. Mater. Chem. A. 2014, 2, 681-91.
6. Zhu, H.; Macfarlane, D. R.; Pringle, J. M.; Forsyth, M. Organic ionic plastic crystals as solid-state electrolytes. Trends. Chem. 2019, 1, 126-40.
7. Sonigara, K. K.; Shao, Z.; Prasad, J.; et al. Organic ionic plastic crystals as hole transporting layer for stable and efficient perovskite solar cells. Adv. Funct. Mater. 2020, 30, 2001460.
8. Pringle, J. M. Recent progress in the development and use of organic ionic plastic crystal electrolytes. Phys. Chem. Chem. Phys. 2013, 15, 1339-51.
9. Matuszek, K.; Piper, S. L.; Brzęczek-Szafran, A.; et al. Unexpected energy applications of ionic liquids. Adv. Mater. 2024, 36, e2313023.
10. Pringle, J. M.; Howlett, P. C.; Macfarlane, D. R.; Forsyth, M. Organic ionic plastic crystals: recent advances. J. Mater. Chem. 2010, 20, 2056.
11. Jin, L.; Nairn, K. M.; Forsyth, C. M.; et al. Structure and transport properties of a plastic crystal ion conductor: diethyl(methyl)(isobutyl)phosphonium hexafluorophosphate. J. Am. Chem. Soc. 2012, 134, 9688-97.
12. Ueda, H.; Saito, N.; Nakanishi, A.; et al. Unveiling the dynamic change in the ionic conductivity of a solid-state binary mixture comprising an organic ionic plastic crystal and LiBF4. Mater. Today. Phys. 2024, 43, 101395.
13. Macfarlane, D. R.; Huang, J.; Forsyth, M. Lithium-doped plastic crystal electrolytes exhibiting fast ion conduction for secondary batteries. Nature 1999, 402, 792-4.
14. Forsyth, M.; Chimdi, T.; Seeber, A.; Gunzelmann, D.; Howlett, P. C. Structure and dynamics in an organic ionic plastic crystal, N-ethyl-N-methyl pyrrolidinium bis(trifluoromethanesulfonyl) amide, mixed with a sodium salt. J. Mater. Chem. A. 2014, 2, 3993-4003.
15. Huang, J. Solid state lithium ion conduction in pyrrolidinium imide-lithium imide salt mixtures. Solid. State. Ion. 2000, 136-7, 447-52.
16. Forsyth, M.; Huang, J.; Macfarlane, D. R. Lithium doped N-methyl-N-ethylpyrrolidinium bis(trifluoromethanesulfonyl)amide fast-ion conducting plastic crystals. J. Mater. Chem. 2000, 10, 2259-65.
17. Macfarlane, D. R.; Forsyth, M. Plastic crystal electrolyte materials: new perspectives on solid state ionics. Adv. Mater. 2001, 13, 957-66.
18. Biernacka, K.; Al-Masri, D.; Yunis, R.; Zhu, H.; Hollenkamp, A. F.; Pringle, J. M. Development of new solid-state electrolytes based on a hexamethylguanidinium plastic crystal and lithium salts. Electrochim. Acta. 2020, 357, 136863.
19. Biernacka, K.; Makhlooghiazad, F.; Popov, I.; et al. Investigation of unusual conductivity behavior and ion dynamics in hexamethylguanidinium bis(fluorosulfonyl)imide-based electrolytes for sodium batteries. J. Phys. Chem. C. 2021, 125, 12518-30.
20. Biernacka, K.; Makhlooghiazad, F.; Popov, I.; et al. Exploration of phase diagram, structural and dynamic behavior of [HMG][FSI] mixtures with NaFSI across an extended composition range. Phys. Chem. Chem. Phys. 2022, 24, 16712-23.
21. Popov, I.; Zhu, H.; Khamzin, A.; et al. Collective ion dynamics in ionic plastic crystals: the origin of conductivity suppression. J. Phys. Chem. C. 2023, 127, 15918-27.
22. Popov, I.; Biernacka, K.; Zhu, H.; et al. Strongly correlated ion dynamics in plastic ionic crystals and polymerized ionic liquids. J. Phys. Chem. C. 2020, 124, 17889-96.
23. MacFarlane, D. R.; Forsyth, M.; Izgorodina, E. I.; Abbott, A. P.; Annat, G.; Fraser, K. On the concept of ionicity in ionic liquids. Phys. Chem. Chem. Phys. 2009, 11, 4962-7.
24. Zhang, Z.; Wheatle, B. K.; Krajniak, J.; Keith, J. R.; Ganesan, V. Ion mobilities, transference numbers, and inverse haven ratios of polymeric ionic liquids. ACS. Macro. Lett. 2020, 9, 84-9.
25. Dyre, J. C.; Maass, P.; Roling, B.; Sidebottom, D. L. Fundamental questions relating to ion conduction in disordered solids. Rep. Prog. Phys. 2009, 72, 046501.
26. Gainaru, C.; Stacy, E. W.; Bocharova, V.; et al. Mechanism of conductivity relaxation in liquid and polymeric electrolytes: direct link between conductivity and diffusivity. J. Phys. Chem. B. 2016, 120, 11074-83.
27. Maass, P.; Meyer, M.; Bunde, A. Nonstandard relaxation behavior in ionically conducting materials. Phys. Rev. B. Condens. Matter. 1995, 51, 8164-77.
28. Roling, B.; Martiny, C.; Brückner, S. Ion transport in glass: influence of glassy structure on spatial extent of nonrandom ion hopping. Phys. Rev. B. 2001, 63, 214203.
29. Romanenko, K.; Pringle, J. M.; O’Dell, L. A.; Forsyth, M. New insights into the thermal behaviour of organic ionic plastic crystals: magnetic resonance imaging of polycrystalline morphology alterations induced by solid-solid phase transitions. Phys. Chem. Chem. Phys. 2015, 17, 18991-9000.
30. Pas, S. J.; Huang, J.; Forsyth, M.; MacFarlane, D. R.; Hill, A. J. Defect-assisted conductivity in organic ionic plastic crystals. J. Chem. Phys. 2005, 122, 064704.
31. Chen, F.; Jin, L.; de, L. S. W.; Pringle, J. M.; Forsyth, M. Atomistic simulation of structure and dynamics of the plastic crystal diethyl(methyl)(isobutyl)phosphonium hexafluorophosphate. J. Chem. Phys. 2013, 138, 244503.
32. Chen, F.; de, L. S. W.; Forsyth, M. Dynamic heterogeneity and ionic conduction in an organic ionic plastic crystal and the role of vacancies. J. Phys. Chem. Lett. 2013, 4, 4085-9.
33. Forsyth, M.; Chen, F.; O'dell, L.; Romanenko, K. New insights into ordering and dynamics in organic ionic plastic crystal electrolytes. Solid. State. Ion. 2016, 288, 160-6.
34. Ishai, P. B.; Talary, M. S.; Caduff, A.; Levy, E.; Feldman, Y. Electrode polarization in dielectric measurements: a review. Meas. Sci. Technol. 2013, 24, 102001.
35. Dyre, J. C. The random free-energy barrier model for ac conduction in disordered solids. J. Appl. Phys. 1988, 64, 2456-68.
36. Schrøder, T. B.; Dyre, J. C. ac Hopping conduction at extreme disorder takes place on the percolating cluster. Phys. Rev. Lett. 2008, 101, 025901.
37. Madsen, I. C.; Scarlett, N. V. Y.; Webster, N. A. S. Quantitative phase analysis. In: Kolb, U.; Shankland, K.; Meshi, L.; Avilov, A.; David, W.; editors, Uniting electron crystallography and powder diffraction. Dordrecht: Springer; 2012, pp.207-18.
38. Bish, D. L.; Howard, S. A. Quantitative phase analysis using the rietveld method. J. Appl. Cryst. 1988, 21, 86-91.
39. Kashyap, H. K.; Annapureddy, H. V. R.; Raineri, F. O.; Margulis, C. J. How is charge transport different in ionic liquids and electrolyte solutions? J. Phys. Chem. B. 2011, 115, 13212-21.
40. Schoenert, H. J. Evaluation of velocity correlation coefficients from experimental transport data in electrolytic systems. J. Phys. Chem. 1984, 88, 3359-63.
41. Ahmed, M. D.; Zhu, Z.; Khamzin, A.; Paddison, S. J.; Sokolov, A. P.; Popov, I. Effect of ion mass on dynamic correlations in ionic liquids. J. Phys. Chem. B. 2023, 127, 10411-21.
42. Noda, A.; Hayamizu, K.; Watanabe, M. Pulsed-gradient Spin-echo 1H and 19F NMR ionic diffusion coefficient, viscosity, and ionic conductivity of non-chloroaluminate room-temperature ionic liquids. J. Phys. Chem. B. 2001, 105, 4603-10.
43. Tokudaa, H.; Hayamizu, K.; Ishii, K.; Abu, B. H. S. M.; Watanabe, M. Physicochemical properties and structures of room temperature ionic liquids. 1. Variation of anionic species. J. Phys. Chem. B. 2004, 108, 16593-600.
44. Tokudaa, H.; Hayamizu, K.; Ishii, K.; Abu, B. H. S. M.; Watanabe, M. Physicochemical properties and structures of room temperature ionic liquids. 2. Variation of alkyl chain length in imidazolium cation. J. Phys. Chem. B. 2005, 109, 6103-10.
45. Tokudaa, H.; Ishii, K.; Abu, B. H. S. M.; Tsuzuki, S.; Hayamizu, K.; Watanabe, M. Physicochemical properties and structures of room-temperature ionic liquids. 3. Variation of cationic structures. J. Phys. Chem. B. 2006, 110, 2833-9.
46. Tokudaa, H.; Tsuzuki, S.; Abu Bin Hasan Susan, M.; Hayamizu, K.; Watanabe, M. How ionic are room-temperature ionic liquids? An indicator of the physicochemical properties. J. Phys. Chem. B. 2006, 110, 19593-600.
47. Sangoro, J. R.; Kremer, F. Charge transport and glassy dynamics in ionic liquids. ACC. Chem. Res. 2012, 45, 525-32.
48. Harris, K. R. Relations between the fractional Stokes-Einstein and Nernst-Einstein equations and velocity correlation coefficients in ionic liquids and molten salts. J. Phys. Chem. B. 2010, 114, 9572-7.
49. Harris, K. R. Can the transport properties of molten salts and ionic liquids be used to determine ion association? J. Phys. Chem. B. 2016, 120, 12135-47.
Cite This Article

How to Cite
Ahmed, M. D.; Martins, M. L.; Abdullah, M.; Singh, H.; Zheng, A.; Greenbaum, S.; Sokolov, A. P.; Popov, I. The ion-ion correlations in organic ionic plastic crystal. Energy Mater. 2025, 5, 500079. http://dx.doi.org/10.20517/energymater.2024.209
Download Citation
Export Citation File:
Type of Import
Tips on Downloading Citation
Citation Manager File Format
Type of Import
Direct Import: When the Direct Import option is selected (the default state), a dialogue box will give you the option to Save or Open the downloaded citation data. Choosing Open will either launch your citation manager or give you a choice of applications with which to use the metadata. The Save option saves the file locally for later use.
Indirect Import: When the Indirect Import option is selected, the metadata is displayed and may be copied and pasted as needed.
About This Article
Special Issue
Copyright

Data & Comments
Data
0


Comments
Comments must be written in English. Spam, offensive content, impersonation, and private information will not be permitted. If any comment is reported and identified as inappropriate content by OAE staff, the comment will be removed without notice. If you have any queries or need any help, please contact us at [email protected].