fig2

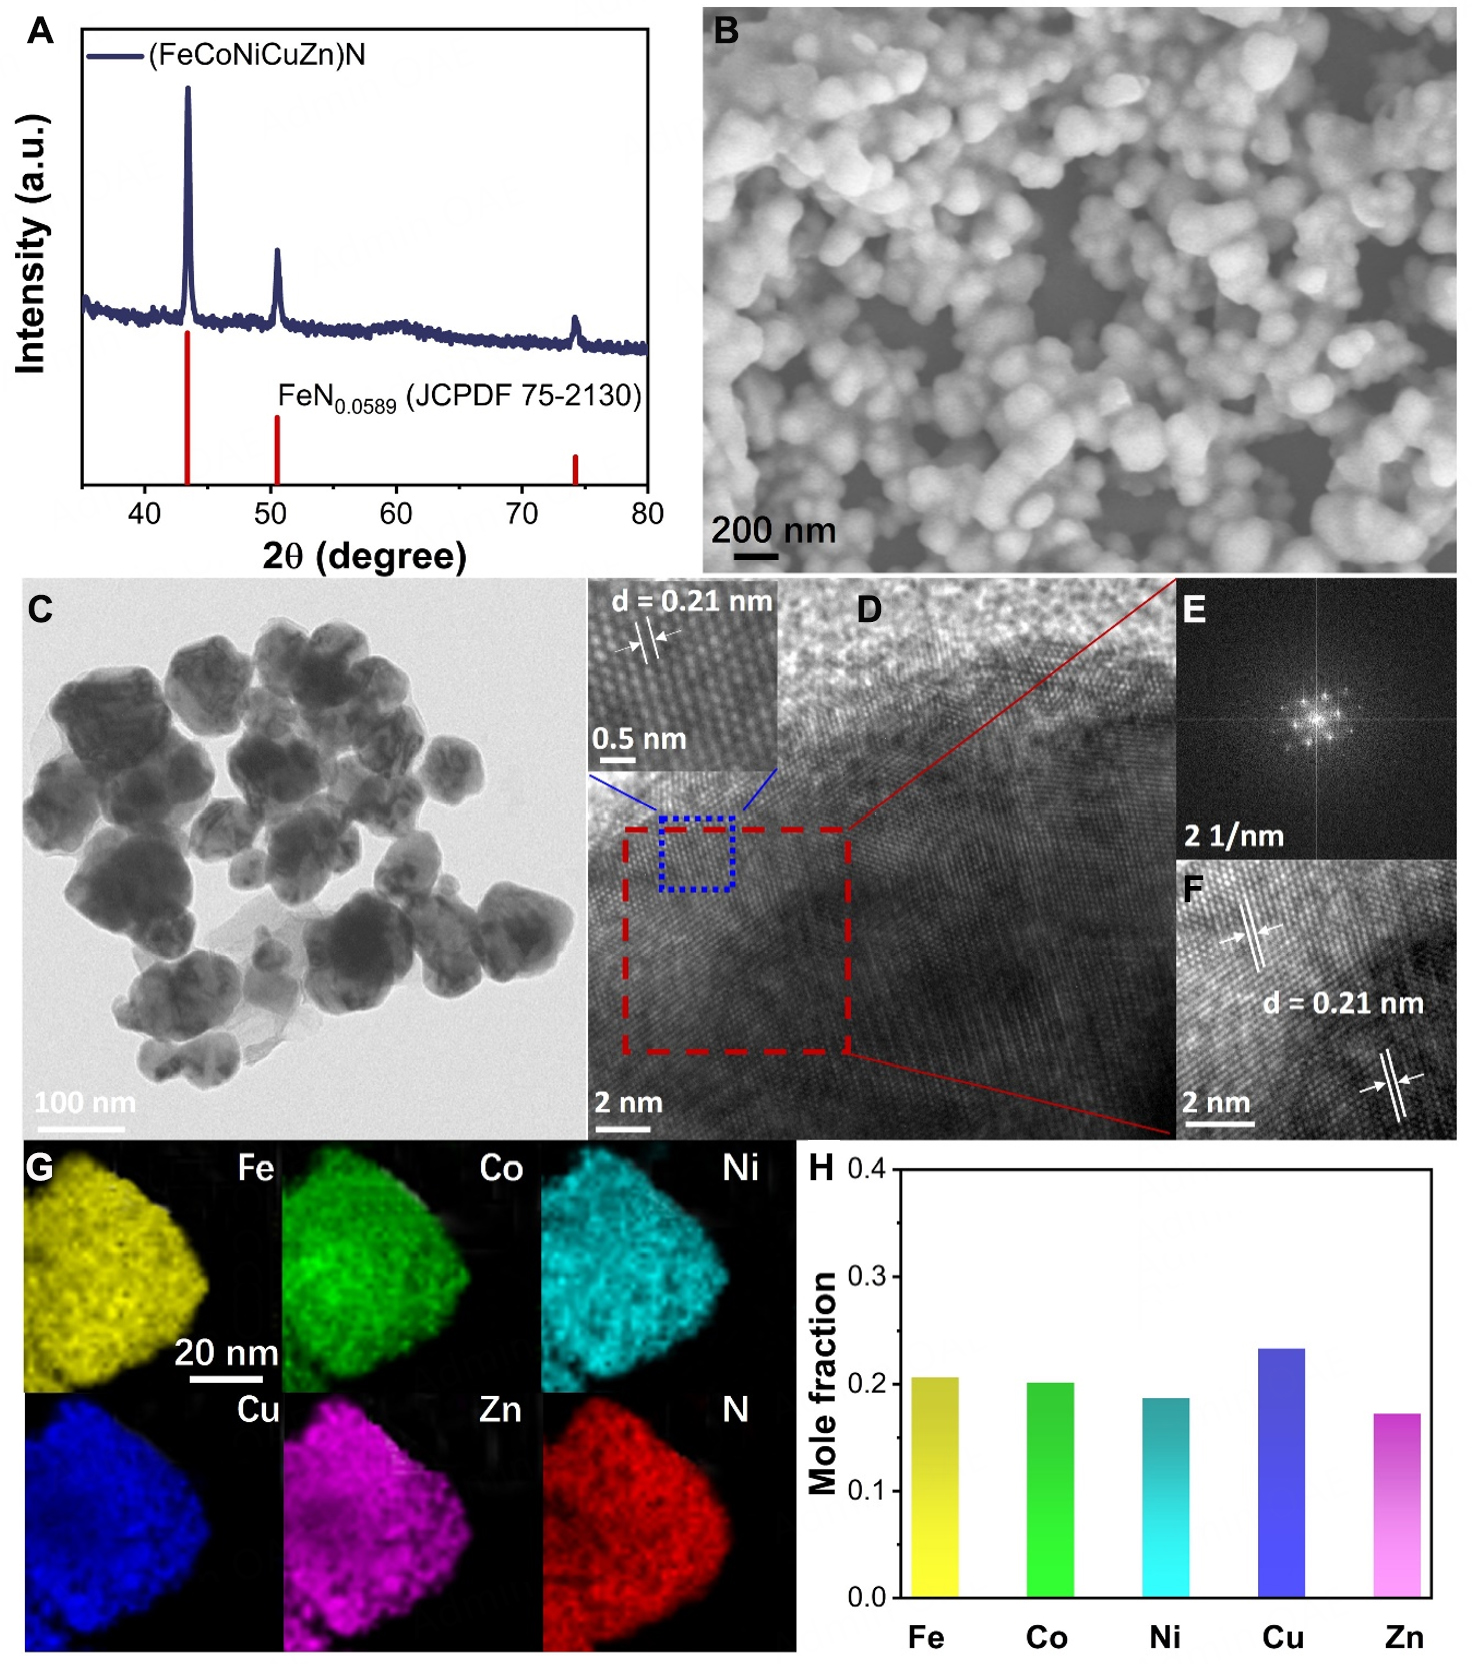
Figure 2. Structural characterization of (FeCoNiCuZn)N. (A) PXRD pattern, (B) SEM, (C) TEM and (D) HRTEM images of (FeCoNiCuZn)N; Inset (D) was the magnified area in blue region. (E) FFT and (F) IFFT pattern of the red region derived from (D); (G) EDS elemental mapping of (FeCoNiCuZn)N: Fe (yellow), Co (green), Ni (cyan), Cu (blue), Zn (purple) and N (red); (H) Mole fraction of (FeCoNiCuZn)N obtained from the ICP-AES result.


